Game Analytics: начало работы с аналитикой
Андерс Драхен (Anders Drachen), главный автор Game Analytics, решил обратиться к тому, что же представляет собой аналитика в игровой индустрии. Он предложил 12 шагов построения работы c подобной информацией. Какие? Читайте в материале.
Аналитика – мощный инструмент, необходимый для информированного принятия решений на стратегическом и оперативном уровнях в процессе разработки игр. Она поможет ответить на ключевые вопросы о дизайне, увлекательности, вовлечении, игровом процессе, монетизации и т.д. Однако аналитика представляет собой относительно новый процесс в разработке игр, и неспециалистам может быть трудно найти полезную информацию.
Аналитика стала широко обсуждаемой темой в области разработки игр в последние годы, причем далеко не только для free-to-play проектов. Однако относительная новизна этого процесса сужает круг знаний, доступных неспециалисту, а доступная информация весьма неструктурирована. Просто погуглив различные термины, можно найти тонны информации об аналитике, поскольку она используется целым рядом отраслей промышленности, что не очень полезно.
Исключив информацию, связанную, например, со здравоохранением, торговлей акциями или анализом клиентов интернет-магазина, и сосредоточив внимание на играх, можно найти ряд постов в блогах, несколько хороших статей в Gamasutra и Game Developer Magazine, презентации с таких отраслевых мероприятий, как Game Developers Conference и Casual Connect, научных статей, официальных документов и информацию из различных сторонних источников аналитики, таких как Game Analytics.
Эти ресурсы, в свою очередь, пестрят огромным количеством сокращений (DAU, MAU, ARRPU, LTV, …) которые могут менять свой смысл в зависимости от контекста. Кроме того, много внимания уделяют аналитике, связанной с монетизацией, то есть процессом анализа поведения игроков с целью получения максимального дохода, а также связанной с free-to-play/онлайн играми. При этом в Интернете гораздо меньше информации об использовании аналитики, которая помогла бы помочь усовершенствовать дизайн, чтобы увеличить удовольствие и вовлечение пользователя. Другими словами, знания фрагментированы и не охватывают многие области, которые важны для тех, кто только начал использовать аналитику в своих играх.
Цель этого поста: попытаться сопоставить некоторые наиболее актуальные для неспециалиста знания о работе с аналитикой, независимо от типа игры или платформы. Данный материал не охватывает все, что нужно знать разработчику игр для создания зрелой методики бизнес-аналитики, однако здесь указан возможный путь.
Начало работы: 12 шагов
Существует много хороших способов начала работы с аналитикой. Модель, которую мы будем обсуждать здесь основана на стандартной модели поиска информации, используемой в бизнес-аналитике практически везде, при этом она адаптирована и изложена в качестве руководства для неспециалиста в игровой аналитике по реализации аналитических практик и получению результатов. Соответственно, статья предполагает, что читатель не имеет никаких предварительных знаний в области аналитики.
Как и все остальное, что стоит делать, необходимо посвятить некоторое время тому, чтобы научиться правильно использовать игровую аналитику. Итак, все по порядку:
- Основы: для начала необходимо понять, что такое аналитика, какую роль она играют в разработке игр и менеджменте. Аналитика — более масштабный инструмент, чем, к примеру, монетизация. Аналитика – инструмент для всей компании, не только для конкретной игры.
- Ключевые термины: на втором этапе нужно познакомиться с ключевыми терминами игровой аналитики и их значением. В связи с новизной использования аналитики в играх, есть некоторые различия в том, как используются основные термины. Без понимания ключевых терминов гораздо сложнее найти нужную информацию.
- Чтение: на этом этапе следует найти ключевые материалы, доступные в Интернете. Это может показаться немного странным, тем не менее, очень важно исследовать опыт, полученный другими людьми, прежде чем задуматься, что сделать в вашей собственной игре.
- Процесс: необходимо изучить процесс аналитики от момента, когда возникают вопросы, до получения ответов на них и изменения дизайна игры или методов работы компании. На процесс аналитики влияет ряд ключевых факторов, в частности, специфические требования заинтересованных сторон.
- Цели: узнав, что такое игровая аналитика, и получив представление о том, как она используется в рамках игровой индустрии, нужно определить, зачем она вам нужна. Аналитика настолько широкая область, что ее можно применять на стратегическом и тактическом уровнях. Осознание полного спектра возможностей и постановка целей – уже достижение, но на начальном этапе реализации и тестирования они должны быть строго скоординированы в соответствии с узким кругом задач. Этот процесс предусматривает эволюционную стратегию прототипирования, при которой аналитика совершенствуется в итеративном режиме, а необходимость начальных инвестиций сводится к минимуму. Постановка целей может быть невероятно трудной задачей, особенно на самых ранних стадиях проектирования, поэтому итеративная разработка помогает получить необходимый опыт в процессе обучения, что является весьма полезным для тех, кто только начинает работать с аналитикой.
- Планирование: поставив цели, необходимо разработать стратегию их достижения. На практическом уровне этот процесс предполагает выяснение того, какие именно данные, необходимо получить для достижения целей, затем как их получить и проанализировать, чтобы достичь конкретных результатов, как их визуализировать и преподнести заинтересованным сторонам. Этот этап включает несколько шагов, каждый из которых охватывает рассмотрение, выбор, планирование иерархии сообщений, требования заинтересованных сторон, анализ и визуализацию. Может показаться, что придется потратить много времени на планирование, прежде чем начать сбор данных, но это не так: сложность планирования прямо пропорциональна сложности цели. Если все, что вы хотите знать – сколько игроков соревнуется в вашей игре, планирование пройдет весьма просто. Если вы хотите получить возможность заниматься 3D картами активности, профилированием игроков через кластерный анализ или отслеживать сотни или тысячи моделей поведения, процесс поиска информации будет более сложным, и его планирование займет некоторое время. Как упоминалось выше, применение эволюционной стратегии прототипирования – начинать с малого и постепенно наращивать обороты – рекомендуется всем неспециалистам или при работе с незнакомыми типами игр.
- Сбор информации: после постановки четких целей аналитики, пришло время для сбора данных. Для этого есть много способов – разработка встроенной системы, использование сторонних средств и др. Предположим, что была внедрена определенная система сбора данных.
- Анализ: пора анализировать собранные данные. Опять-таки существует много способов, чтобы справиться с этой задачей. Часто простые статистические методы, такие как вычисление средних значений или сумм, дают всю необходимую информацию, в других случаях придется обратиться к многомерной статистике или методам машинного осмысления данных.
- Визуализация: после анализа данные должны быть визуализированы так, чтобы они были понятны аудитории. Если аналитик сам является этой аудиторией, данный процесс окажется относительно простым, поскольку все цифры ему знакомы. Однако люди разных профессий, как правило, мыслят по-разному. Например, в то время как аналитик будет счастлив, получив таблицу данных, дизайнеру, возможно, потребуется их визуальное представление. Хорошо известным примером визуализации в индустрии является карта интенсивности, которая наглядно отражает, например, смерть героев внутри виртуальной среды.
- Отчетность: теперь пришло время показать результаты проделанной работы команде, управляющим, коллегам в области маркетинга, исследователям пользователей, тестировщикам и т.д.
- Реализация: получив какие-либо удовлетворительные результаты, можно сформулировать рекомендации, как изменить дизайн игры, процесс работы или что-либо еще. Эту работу редко поручают аналитикам – они сообщают о результатах, но принятие решений является прерогативой экспертов в различных областях. Например, если было установлено, что игрокам пришлось потрудиться, чтобы пройти определенного босса, так как они не нашли скрытый реактивный гранатомет, аналитик обычно представляет результат, но оставляет дизайнерам право решить, как лучше сделать этот гранатомет более заметными. Известно, что исследования Microsoft Studios основаны на создании успешного и плотного взаимодействия команд, занятых исследованием пользователей, тестированием, аналитикой и проектированием.
- Зрелость: пройдя первый цикл планирования, сбора данных, анализа, можно сделать шаг вперед – может быть, стоит отследить больше данных, использовать более сложные методы анализа, провести эксперимент с интерактивной визуализацией данных, почитать об аналитике в других секторах промышленности и посмотреть, если есть там идеи, полезные для вашей конкретной ситуации и т.д. Перед вами открыты возможности неограниченного масштаба.
Каждый из этих этапов Андерс рассматривает в своих постах в блоге Game Analytics. Их мы опубликуем в будущем.
От редакции: Оригинал был написан Андерсом Драхеном (Anders Drachen), главным игровым аналитиком Game Analytics. Он является одним из самых печатаемых экспертов по вопросам игровой аналитики, сбора игровых данных, исследований, объектом которых являются пользователи, и т.д.
Game analytics что это за папка
Reddit and its partners use cookies and similar technologies to provide you with a better experience.
By accepting all cookies, you agree to our use of cookies to deliver and maintain our services and site, improve the quality of Reddit, personalize Reddit content and advertising, and measure the effectiveness of advertising.
By rejecting non-essential cookies, Reddit may still use certain cookies to ensure the proper functionality of our platform.
For more information, please see our Cookie Notice and our Privacy Policy .
Get the Reddit app
The largest community for the game RUST. A central place for discussion, media, news and more. Mostly PC users, for console Rust please use r/RustConsole.
Can we get some clarification on this? how to disable or remove it and what exact data does it collect? what companies is this data shared with? e.g. EAC. Is this gameanalytics.com? You can find it in: C:\Program Files (x86)\Steam\steamapps\common\Rust\RustClient_Data\Managed\GameAnalytics.dll
In the privacy policy it states "We may engage third party service providers in the course of providing the Facepunch Services to you (e.g. data storage, server hosting, customer and technical support, game analytics etc) which may require them to access your information on our behalf. We will ensure there are appropriate contractual arrangements in place with any such third party service providers to protect your information. Those third parties may also collect some information directly from you (e.g. IP address, unique identifiers etc) subject to their own privacy policies."
Is this the same service gmod users are complaining about? the spyware marking stuff? you mention "subject to their own privacy policies" but you don't mention the 3rd parties so how can we read their policies? u/garryjnewman
Game analytics что это за папка
15 июл. 2018 в 20:42
Let me save you some time. I like Big Breasted Red Heads, Pizza and Pictures of Puppies (one of those is a lie, you tell me which one it is).
Can we not have one Game without Embedded ♥♥♥♥♥♥♥♥?
On that note, if you want to include a Pizza Parlor/strip club on your stations, I would totally throw down another $5 for that DLC.
15 июл. 2018 в 22:07
 18 июл. 2018 в 2:02
We understand the importance of this to some players, so we’ve added the ability to turn off game analytics entirely, from the options menu.
This option will be available starting from the next build that is currently being tested on the beta branch and will be uploaded on the main one in the next few days.
Please note however that GameAnalytics is not being used to track any information about your internet activity and the data sent are completely anonymous.
To answer your question, we decided to implement it because it’s a very useful tool to track instability issues and other bugs in the game automatically and has so far helped the devs to improve the state of the game. Sorry for not having immediately added the possibility to switch it off.
18 июл. 2018 в 4:46
Let me save you some time. I like Big Breasted Red Heads, Pizza and Pictures of Puppies (one of those is a lie, you tell me which one it is).
Can we not have one Game without Embedded ♥♥♥♥♥♥♥t?
On that note, if you want to include a Pizza Parlor/strip club on your stations, I would totally throw down another $5 for that DLC.
18 июл. 2018 в 4:55
We understand the importance of this to some players, so we’ve added the ability to turn off game analytics entirely, from the options menu.
This option will be available starting from the next build that is currently being tested on the beta branch and will be uploaded on the main one in the next few days.
Please note however that GameAnalytics is not being used to track any information about your internet activity and the data sent are completely anonymous.
To answer your question, we decided to implement it because it’s a very useful tool to track instability issue and other bugs in the game automatically and has so far helped the devs to improve the state of the game. Sorry for not having immediately added the possibility to switch it off.
18 июл. 2018 в 13:29
Let me save you some time. I like Big Breasted Red Heads, Pizza and Pictures of Puppies (one of those is a lie, you tell me which one it is).
Can we not have one Game without Embedded ♥♥♥♥♥♥♥t?
On that note, if you want to include a Pizza Parlor/strip club on your stations, I would totally throw down another $5 for that DLC.
Wow, please educate us on how you manage to find out. I am getting paranoid about my other games.
Found a GameAnalytics folder in C:\Users\Yourcomputername\AppData\Local Checked the Date of the Database File it created crosschecked that to Last played on steam. started Up Objects in space and rechecked the Database File and Verified the Use date update.
I try to clear out AppData\Local\temp Every once in a while so when I see new folders I get curious and do some investigating. (I don’t recommend the unexperienced Deleting things willy nilly).
I have no problem with people partying on my lawn. I just get pissy when they leave their trash everywhere (AND EVERYBODY LEAVES THEIR TRASH in \AppDATA\ EVERYONE. Google, Microsfoft, Game Companies, etc. Its a Happening Spot.
GameAnalytics V3 now live!
Lately we’ve talked a lot about some exciting updates coming to GameAnalytics, and over the past few months you’ve been able to get a small taste of these changes with our V3 Open Beta. Thank you to everyone who took part and shared valuable feedback. We’ve been listening to your comments and they’ve helped us polish the V3 experience a whole lot more.
What’s happening?
In this post, we’ll cover all of the nitty-gritty details about this release. But, if you’re short on time, here’s a very quick summary of what’s happening…

How gaming studios use DataSuite to find hit games
TL;DR — V3 is going to be officially released as the default tool
- The legacy solution will be available for the next 6-8 months (or more).
- Users will be selected in groups to enter the new solution (all users will be transitioned over 5-10 days).
- V3 delivers a major update to key features – improvements will continue to be rolled out
- New features are already in development and will be introduced in 4-6 months.
- Certain options (e.g. metrics) lack feature parity with previous solutions. These will be added during the coming months! Let us know your feedback.
Click here to jump straight to release details where you can learn even more about the new functionality introduced!
What is V3 and what do I get out of it?
V3 is just one of many improvements we have been working on to make GameAnalytics the best and most cost effective platform for devs of all types – from indies to publishers, on everything from mobile, to Roblox and PC. Firstly, this new solution delivers a more powerful analytics tool. It’s more user friendly, way faster and packed with many new features and options.
- Funnels have been rebuilt to respond in seconds instead of minutes.
- Explore Tool has been supercharged with many more options for filtering, grouping, splitting the data and aggregating per user or session on all metrics.
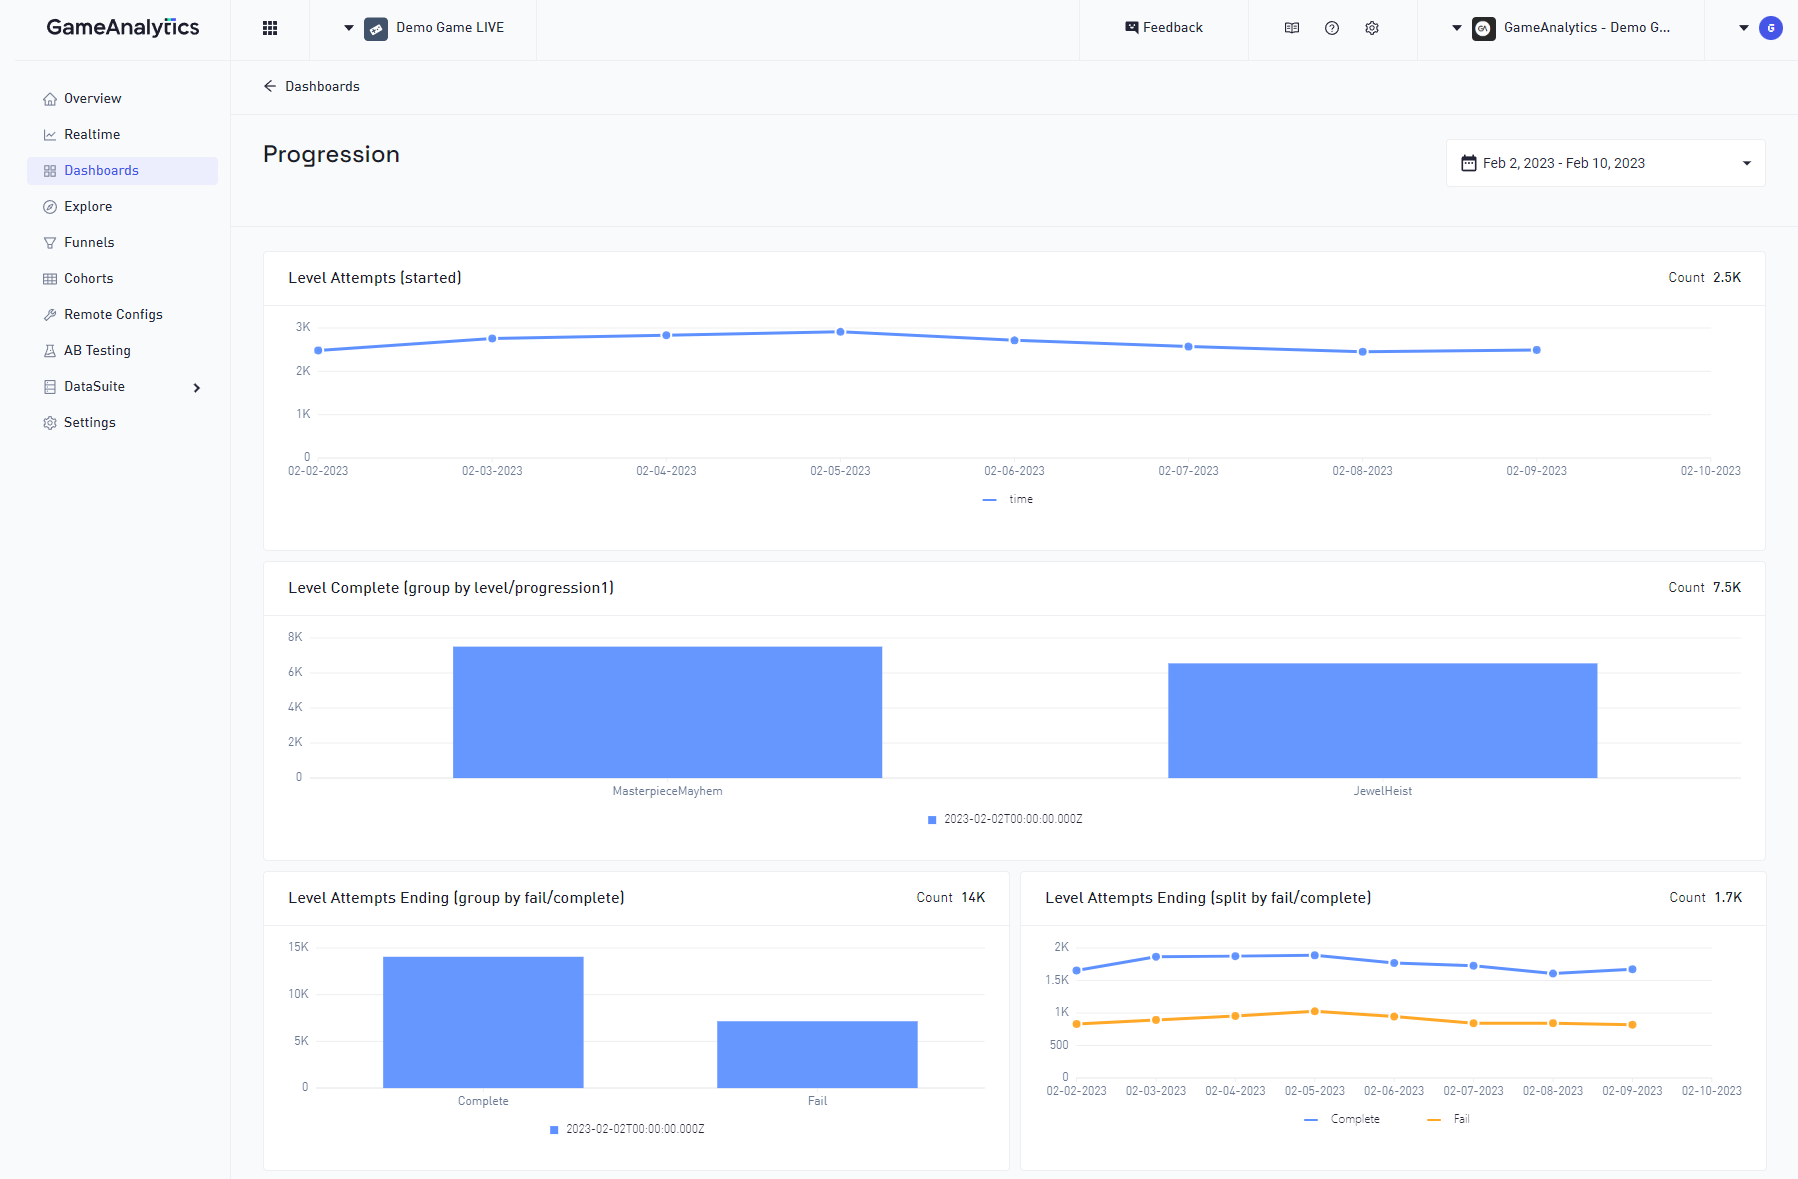
- Dashboards now support all query options available allowing the creation of customized views of the specific insights you need to review daily.
- Additional industry insights are now available in a free version of our market benchmarking tool now included within the core GameAnalytics experience.
Secondly, one of our key priorities was to deliver new, flexible and secure systems that operate at high efficiency. Accordingly, GameAnalytics is now SOC II and ISO 27001 compliant, and our systems are effortlessly able to deliver billions of events into a range of low-cost game data processing tools (DataSuite). This is all part of our larger vision to enable devs to turn their data into insights, no matter how custom their requirements, whilst staying on top of changing privacy compliance regulations.
Finally, these technical changes also give us at GameAnalytics a flexible foundation to enable continued platform improvements and agile releases, now and into the future.
Why change GameAnalytics?
While many of you have enjoyed using the legacy analytics solution, from an engineering perspective it was becoming more difficult to deliver those much-requested new features and functionality mentioned above, due to aging and inflexible technology.
For context, in 2018 GameAnalytics overhauled a legacy backend system and replaced it with a modern query solution. The existing V2 analytics tool was altered to support this new backend resulting in GameAnalytics V2.5. This change introduced powerful new options that users have enjoyed since, including the ability to perform powerful and granular multi-dimensional filtering.
However this meant that we were developing two systems that were not originally meant to work together and it resulted in several edge-case issues and limitations. V3 is built to natively support our modern query solution and all of its advanced options. This updated foundation will allow features to be built much faster and feedback addressed quickly. Stay tuned for more features to be introduced during 2023 and beyond!
How do I access it?
The updated version is officially released and will gradually (over 5-10 days) redirect users into V3 instead of the previous solution. You might already be entering the new solution by default.
How do I switch back to the previous version?
Change is often difficult and therefore we will continue to keep the legacy tool available for at least 6-8 months. From the home screen you can access the legacy tool via the menu in the top navigation.

If you keep going back or want to share feedback then please get in touch! You can get in touch with our friendly support team, or use the feedback button on the top navigation bar.

What’s new?
Over the coming months we will release more in-depth articles on each feature and how to use it optimally. In the meantime you can read on to learn more about the key updates introduced. Note that major updates have been made to Funnels, Explore Tool and Dashboards. Read on to learn more details on each feature.
Brand new UI
The first thing you will notice is the updated design and navigation. On the top-bar you can select features, access the game selector or change the active organization.

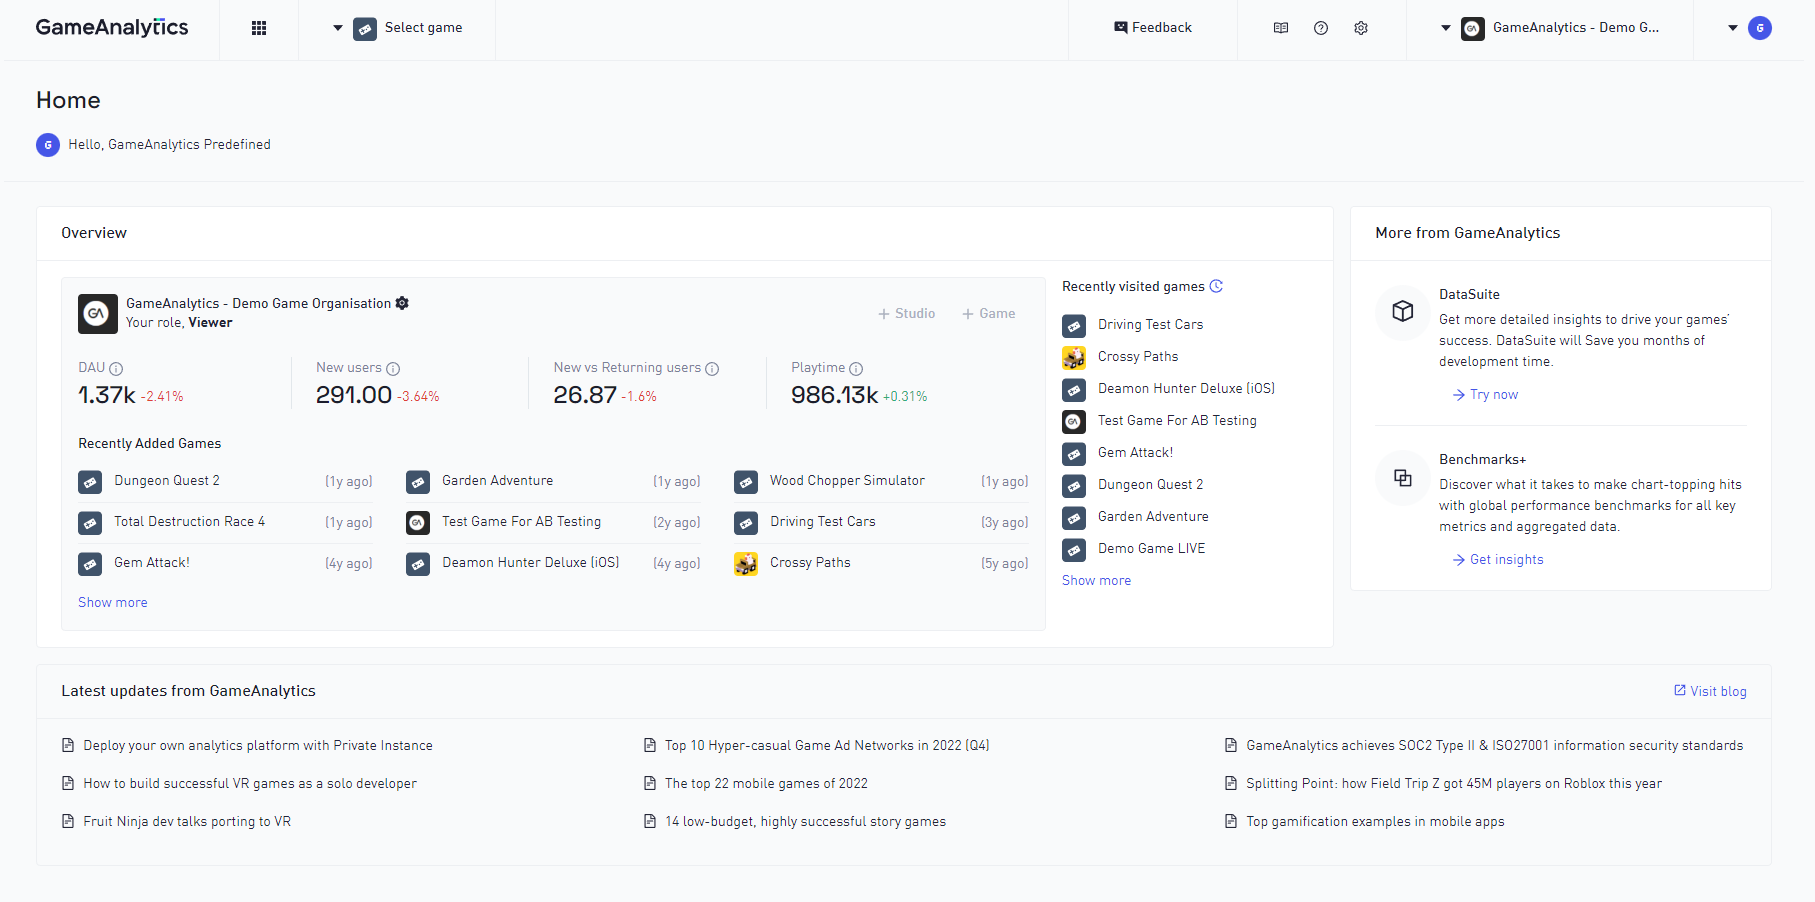
Home Page
After login you will enter the Home Page. It has been altered to show a mix of Organization details and now lists the most recent games you have accessed to easily continue from a previous session. This is also the place to access and accept invitations to other resources.
- View a list of your recently accessed games
- Overview of Organization key metrics and recently created games
- List of product updates and blog posts from GameAnalytics
ⓘ Metrics for each game are not included like seen on the legacy solution. We are working actively on a new feature called ‘Organization Overview’ providing the same functionality + more.
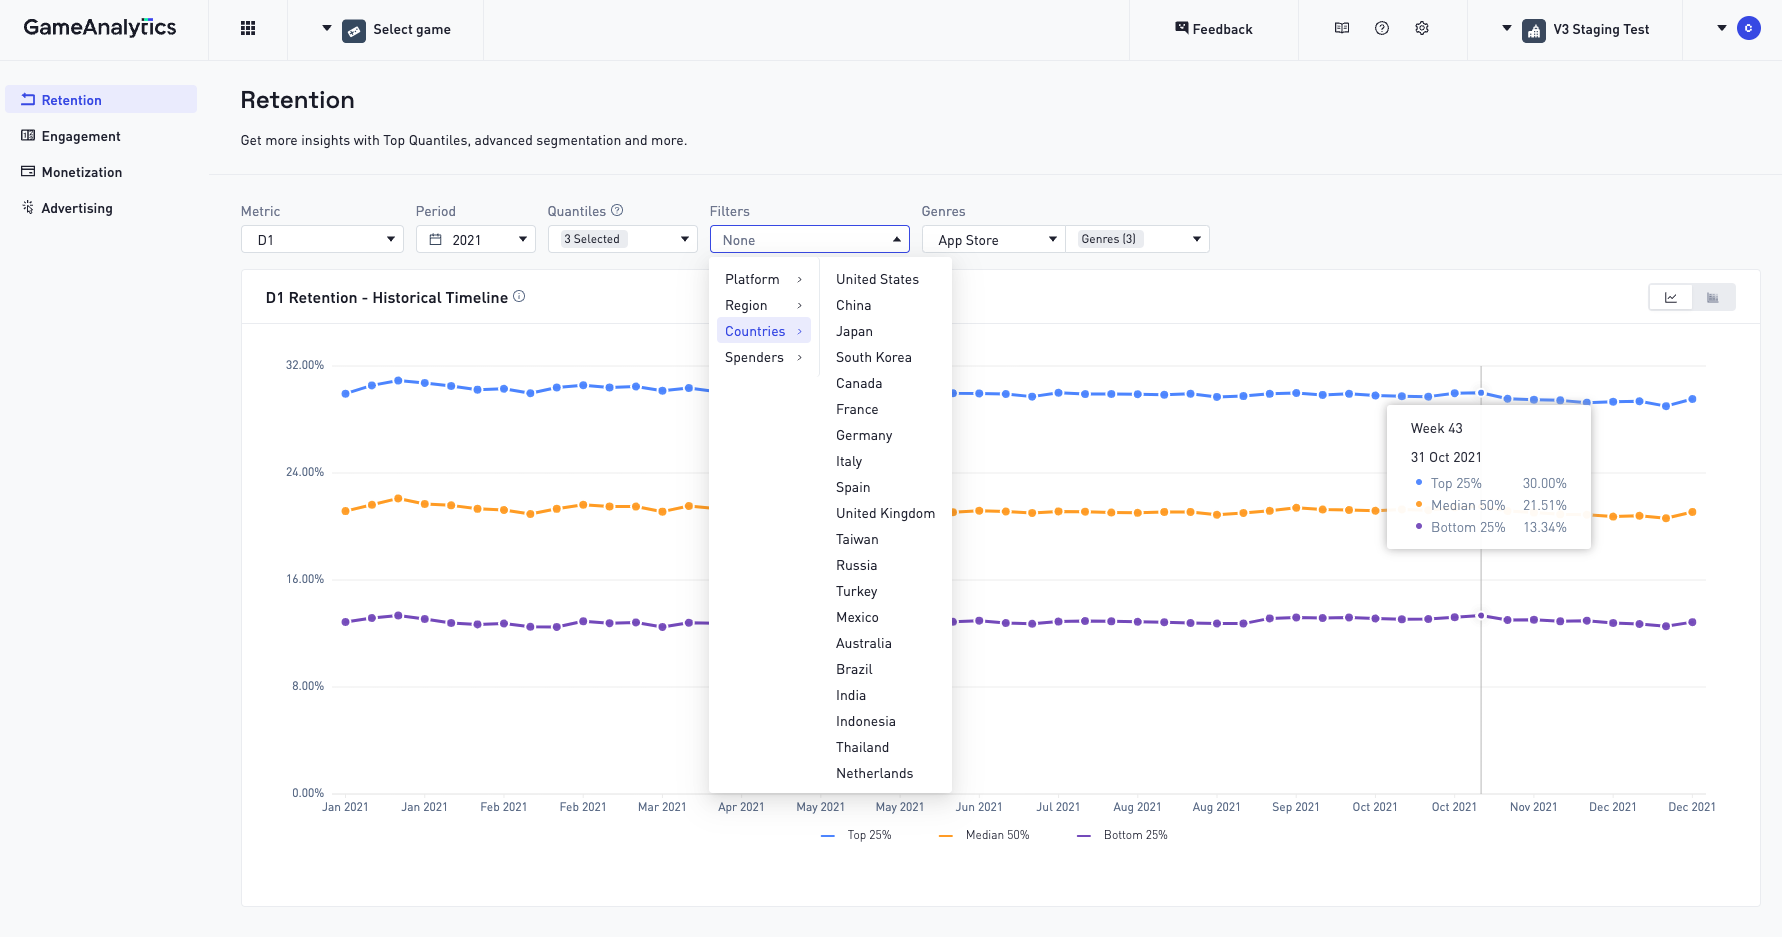
Benchmarks+
We are pleased to have introduced the free version of our popular benchmarking tool from GameIntel. This tool gives insights into global performance benchmarks for all key metrics, from aggregated data across more than 150,000 games on the GameAnalytics network.
In the near future we’ll add paid benchmarks tiers, along with more market intelligence features.
Funnels
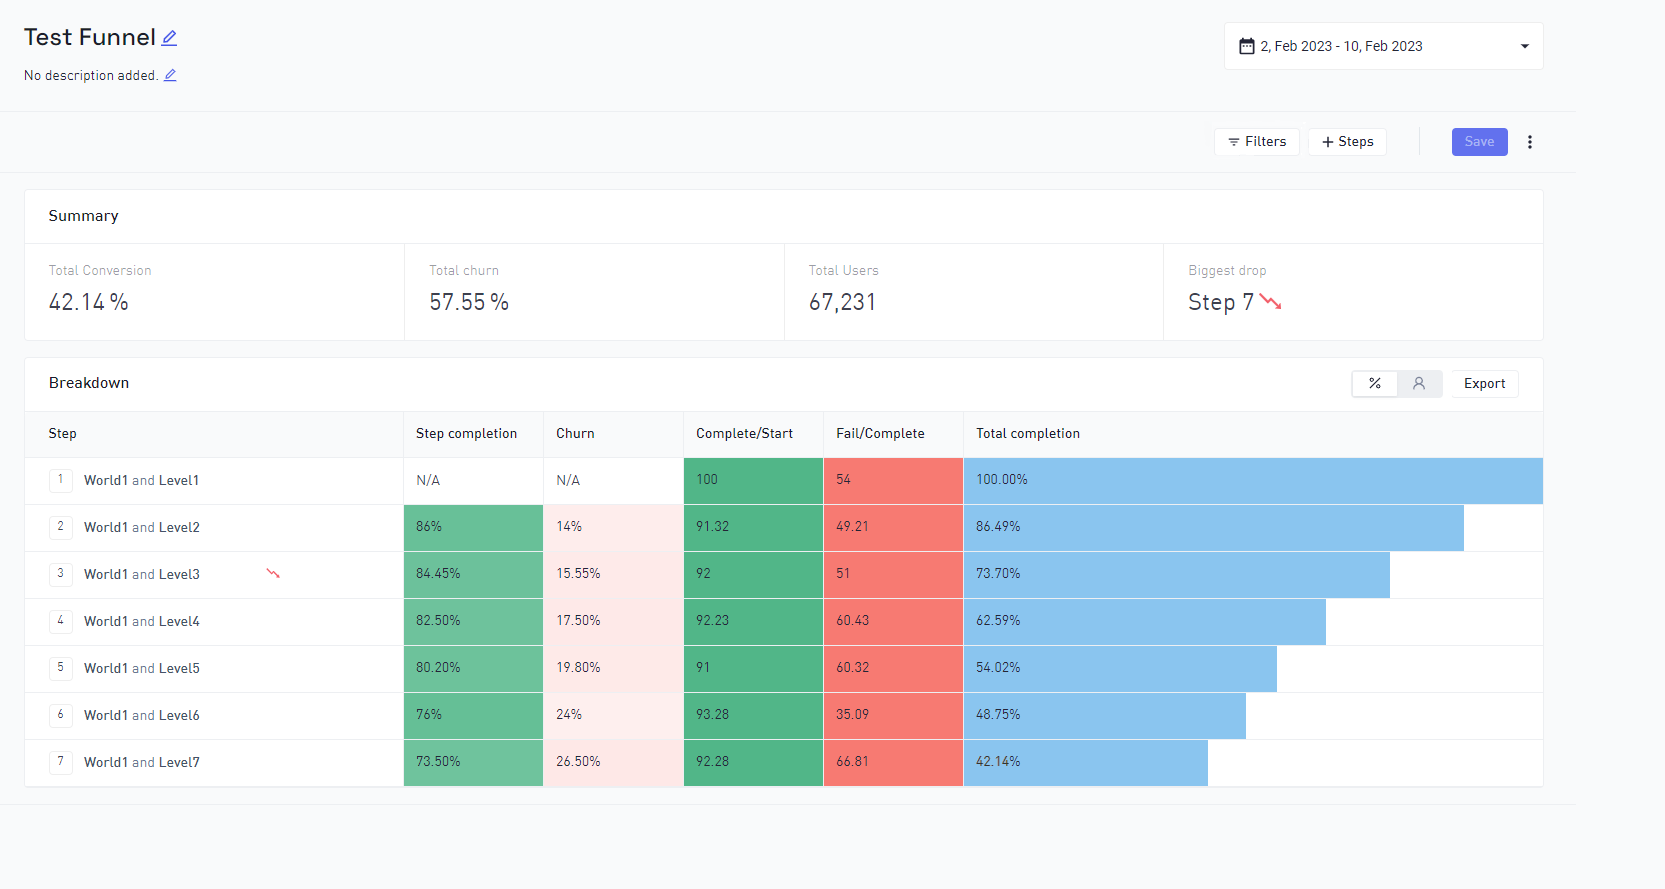
The Funnels feature has been rebuilt using a new backend solution.
- Results delivered almost instantly
- Progression funnel-type introduced focusing on levels to deliver more insights related to completion ratios for each step.
- Bulk step creation made easy. Simply select more than one value for a step event value and choose to split into several steps (e.g. 10 level names)
- Funnels can be saved and reused
ⓘ Funnels created and saved in the previous version will not carry over to the new version of Funnels.
Explore Tool
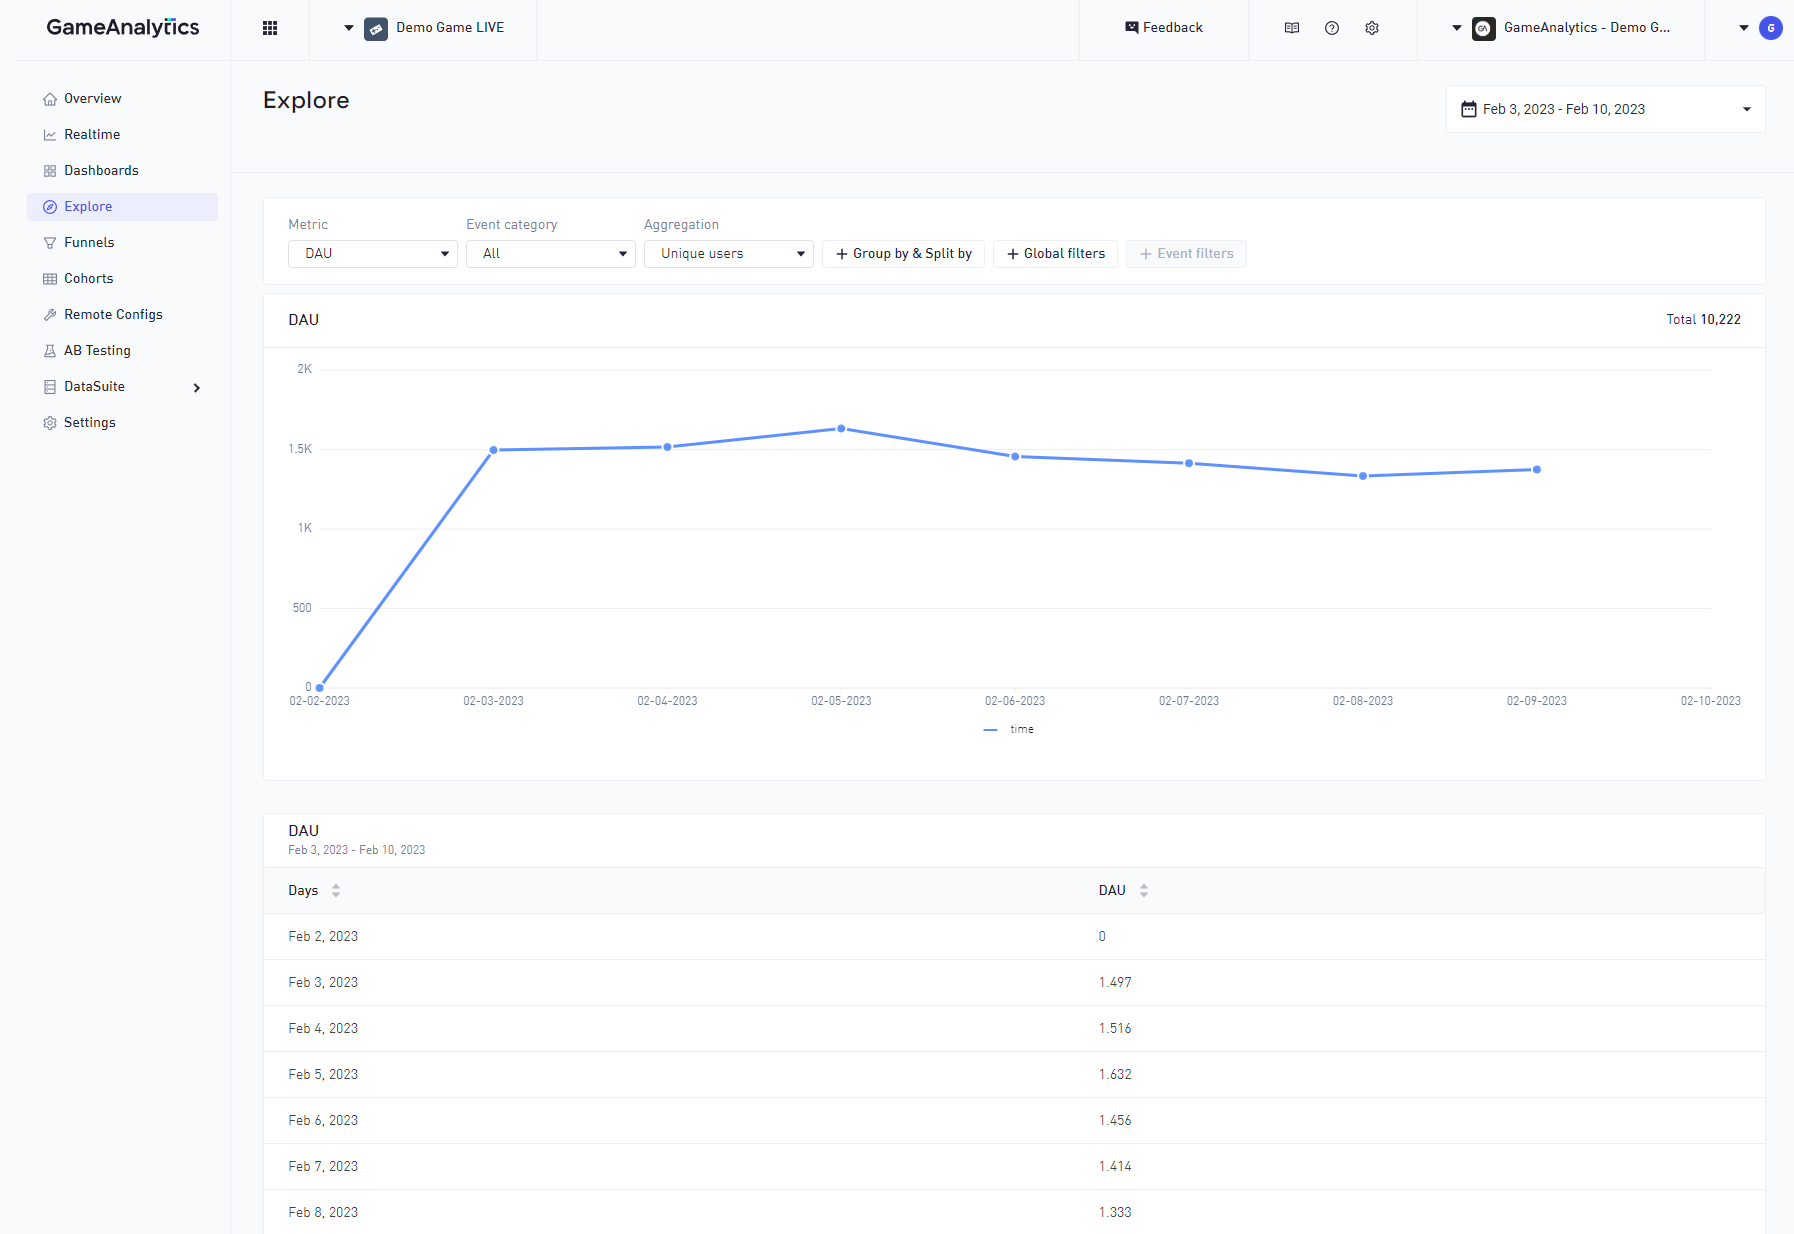
Restructured how queries are created to better align with the underlying data dimensions and event-types resulting in a much more flexible and intuitive experience.
- Added a GroupBy option called “All” causing aggregation to a single number (e.g. total Revenue last 10 days).
- Global aggregation options unlocked. Use “count”, “unique users” or “unique sessions” for all queries.
- Mean aggregation supported per unique user or per unique session. Weighted mean aggregation supported when using Group By set to All.
- Intuitive GroupBy and SplitBy interface allowing control on query limits (max values returned)
- Global Filters supporting a nested AND/OR definition and EXCLUDE. Added filters for “First Build”, “New or Returning”, “Engine Version”, “SDK Version”
ⓘ At release the Explore Tool will be missing certain unique metrics (e.g. Win/Loss Ratio, New vs. Returning Users) and certain functionality like comparing 2 different metrics and sorting. All these areas are in development and will be delivered soon. Queries created in the previous version will not carry over.
Dashboards
- Custom dashboards now support the full extended query options from Explore Tool allowing many permutations of metrics to be added
- New widget called Metric showing a single number (e.g. Total Revenue) using the query option GroupBy set to All
- Initially supporting Line-chart, Bar-chart and Metric visualization
- Predefined dashboards available for easy access
ⓘ At release the Dashboards feature will lack certain feature parity. These are actively being worked on. We aim to soon release filtering of dashboards, widget zoom, additional visualization options and sharing the dashboards. Dashboards created in the previous version will not carry over.
Settings and User Management
All settings have been restructured to be more centralized around an Organization.
- Full list of users having some access to resources on the Organization
- Bulk Invite users to Games, Studios and Organizations
- Look at other user-profiles on the Organization (if you have access)
- Handle archived games or studios more easily
- + more
Game Selection UI
An updated UI for selecting games.
- Select games across organizations (all games available for a user)
- Quickly open recently accessed games
- Much faster performance for larger studios having 1000’s of games
- Pinned games list (personal pinned list)
ⓘ After release a new column showing DAU with sorting enable will be added informing users of game size when selecting.
What’s next?
We know that some of the features you’re used to might not be available yet, but don’t worry! We’re working hard to bring everything over from the old solution as quickly as we can.
We’d love to hear your feedback and suggestions! You can reach out to us through the support channels or the feedback button in the tool. We’re always looking for ways to make things better, and your input is invaluable.