How to Create a Data Flow Diagram in Visio
EdrawMax specializes in diagramming and visualizing. Learn from this article to know everything about how to make a data flow diagram in Visio and easier way. Just try it free now!
In an operation and logistics company, a data-flow diagram is considered a diagramming technique to represent data flow through a system. The data flow diagram, commonly known as DFD, provides information about the output and input entities and the information process itself. While creating a data flow diagram, users tend to use a standardized set of symbols and notations to describe the movement of the data. At the same time, if one has created data flow diagrams in Visio, they must know that DFDs make it easy to depict the overall requirements of the business by illustrating the sequence of different process steps and flow of information using a graphical representation rather than a textual description.
As an academic student, you must wonder what a data flow diagram is? Or how can you make a data flow diagram in Visio? In this elaborated guide to understand data flow diagrams in detail, we will walk you through how to create a data flow diagram in Visio and how you can follow simple steps in EdrawMax to create a data flow diagram that can be exported in MS Visio file format.

1. How to Create a Data Flow Diagram in Visio
Follow these simple steps to make a data flow diagram in Visio using a free template.
-
Open Visio and Select Template:
Install Microsoft Visio on your computer and click on the icon to launch the app. Templates make it quicker and easier to create a diagram. Microsoft Visio comes with many built-in templates that you can use. Go to ‘New’ to find templates.
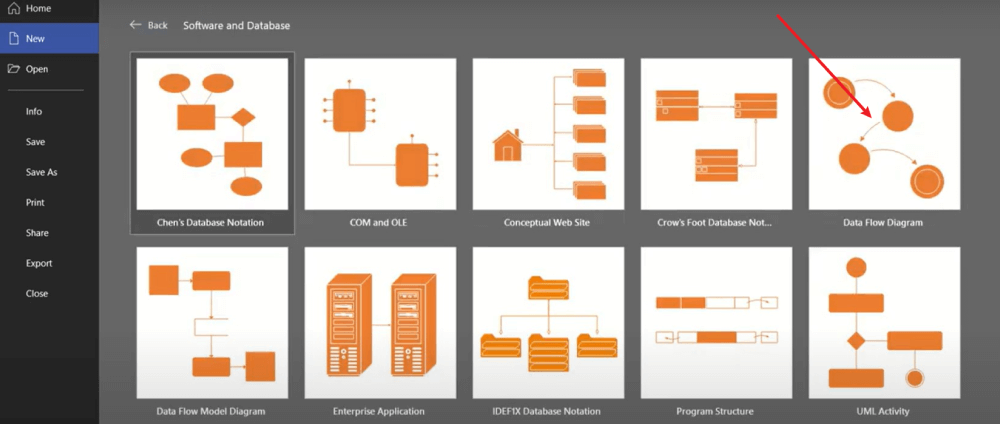
After this, the source of information is required in the whole process. Pull it on the middle page of the diagram there in the shape stencil option. You can also include several other shapes to show the steps, entitles, and stages in the entire process. You can also connect two different shapes to show data flow by using arrows from the connector tool and putting them between the two shapes.
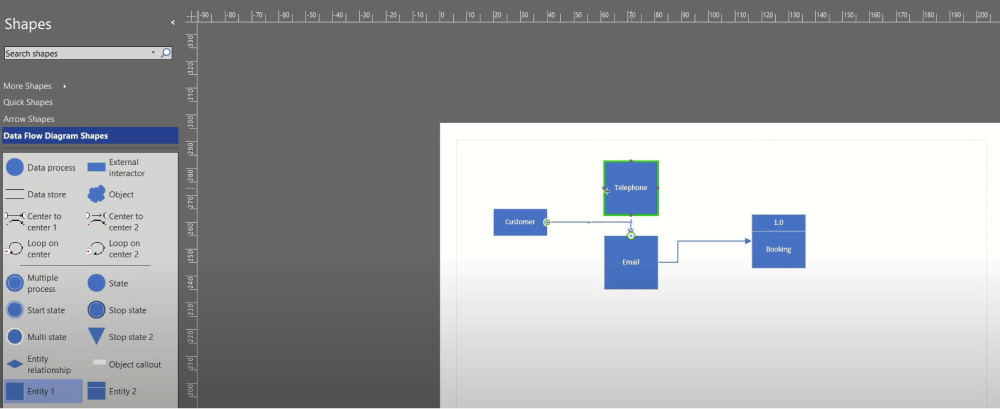
Sometimes if you need to change the direction of the used arrow, you will have to select the desired one and choose the Position on the Home tab, which is available in the Arrange group. Choose either the Flip Vertical or the Flip Horizontal after clicking on Rotate shapes to decide the direction of the arrow.
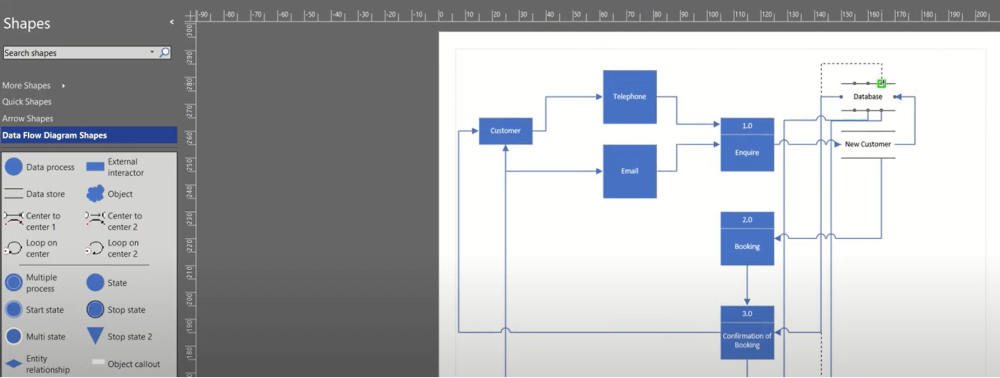
You can choose from various entities and connectors for your data flow chart in Visio. You can also go for other options to make your work attractive. Click on File and then Save As to store your work in the end.
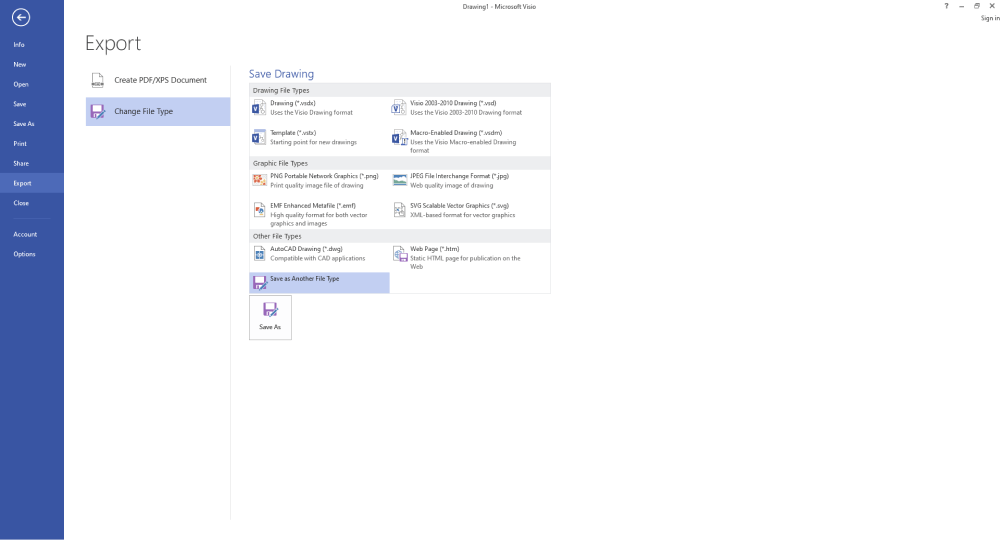
- Open Visio and Select Template;
- Draw the Data Flow Diagram Using the Tools;
- Edit the Diagram;
- Save and Export the File;
2. How to Create a Data Flow Diagram in EdrawMax
Now that you have seen the method to create a data flow diagram in Visio, let us show you the easiest way of creating a similar data flow diagram in EdrawMax.
Step1 Open EdrawMax & Login
The very first step that you need to follow is to install EdrawMax in your system. Go to EdrawMax Download and download the data flow diagram software depending upon your operating system. If you need remote collaboration with your office team, head to EdrawMax Online and log in using your registered email address.
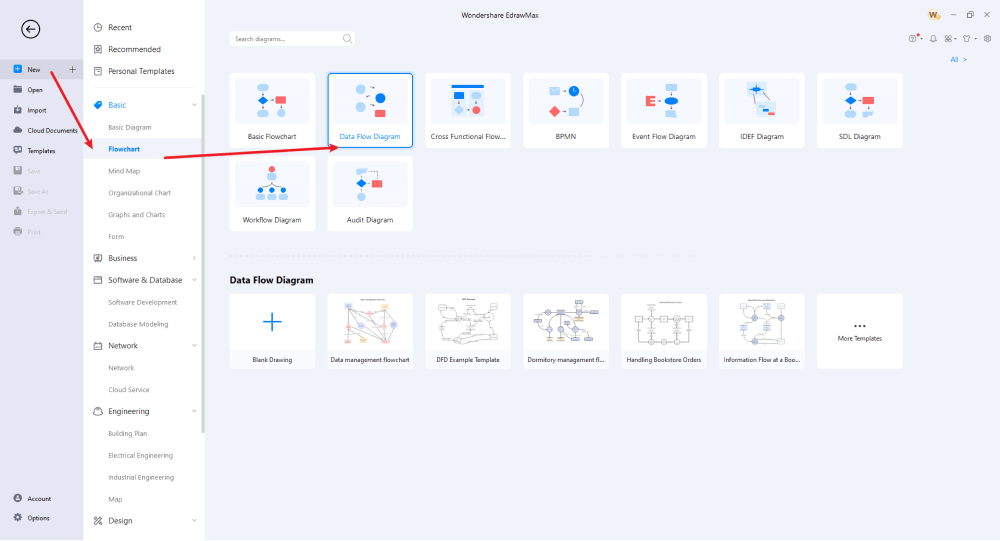
Step2 Select a Template
Unlike other tools, EdrawMax is equipped with over 3,000 templates that make your job extremely easier. Head to ‘Basic‘ followed by ‘Flow Chart‘ on EdrawMax’s homepage. Here you will see different flowchart diagrams, like Basic Flowchart, Cross Functional Flowchart, BPMN, Event Flow Diagram, and more. Click on Data Flow Diagram, and the system will open several Data Flow Diagram templates ready to use. In addition to this, you can head to the ‘Templates‘ section on the left side of this data flow diagram software and search for a Data Flow Diagram. The system will showcase user-generated DFD templates that you can easily duplicate.
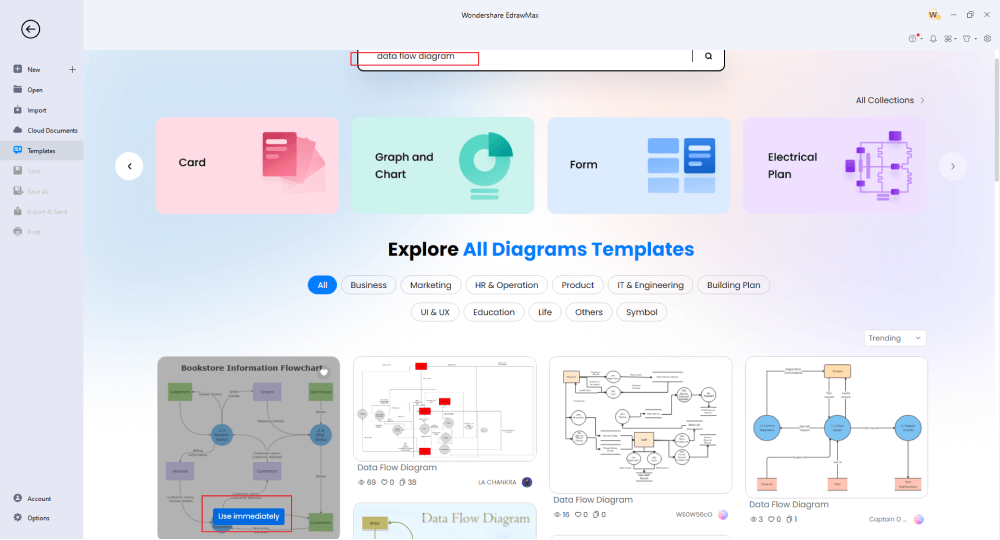
Step3 Create From Scratch
If you previously created a data flow diagram in Visio, you can import it to EdrawMax by clicking on the ‘Import‘ option. At the same time, if you have expertise in creating data flow diagrams, click on the ‘+’ sign that you will find after clicking the Data Flow Diagram in the Flowchart section of EdrawMax. Upon clicking the ‘+’ sign, EdrawMax canvas board, along with the symbols that you might require in order to create the data flow diagram. You can start creating the data flow diagram by first creating the entity, followed by different processes of it.
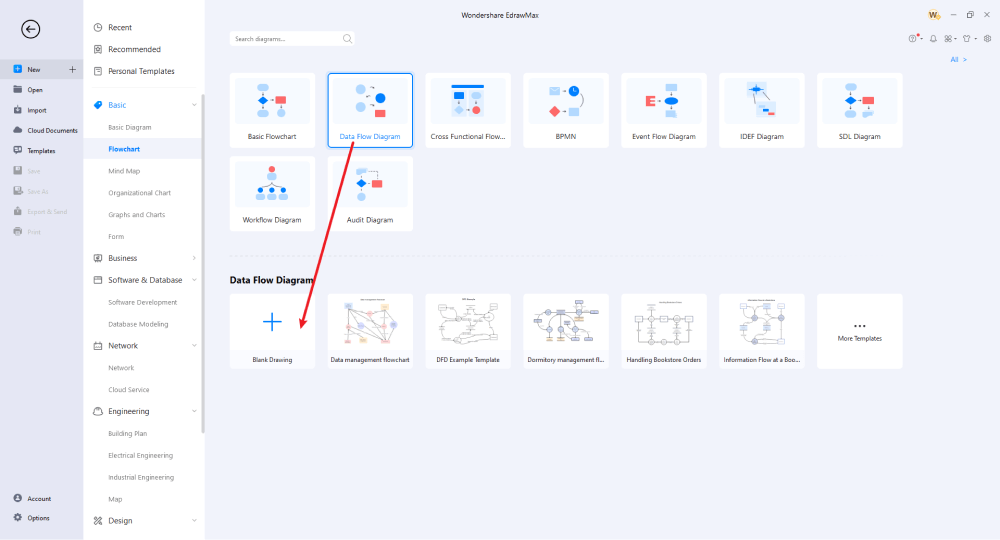
Step4 Add Symbols & Components
EdrawMax has over 26,000 vector-enabled symbols. Some of the most common data flow diagram symbols readily available are External Entity, Entity, Process, Multiple Process, State, and more. Even if you cannot find the required data flow diagram symbol, you can head to the ‘Symbols‘ section from the toolbar and create a personalized data flow diagram symbol using the Pen or Pencil Tool. Once you have started adding external and internal entities, you can connect the data flow diagram using different components. The major elements of any data flow diagram are an entity, process, data store, and data flow. Use these components as and when it is required.
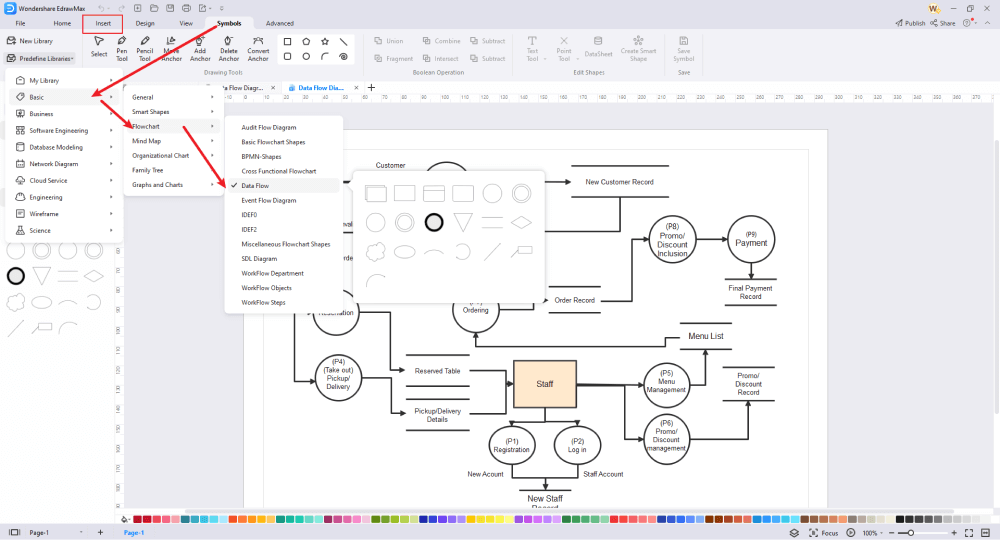
Step5 Export & Share
After you are done making the data flow diagram, you can export it into multiple formats, like JPEG, JPG, PNG, Tiff, PDF, HTML, SVG, Office, and even Visio. You can also share this data flow diagram via email by copying the link to the diagram.
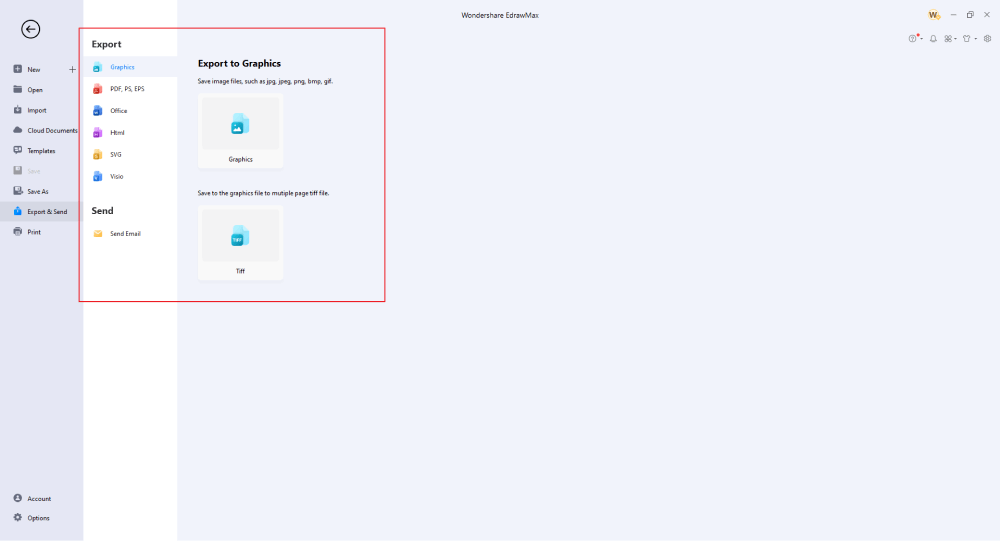
Basically, it is simple to draw a data flow diagram in EdrawMax, just grab a template and keep customizing, drag and drop professional data flow diagram symbols to make your drawings better. If you are still confused about how to draw a data flow diagram in EdrawMax, just check the video below.
3. EdrawMax vs. Visio
As you saw from the steps mentioned above, creating a data flow diagram in Visio takes effort, but with the ready-to-use templates offered by EdrawMax, the same task can be achieved in just a few minutes. Some of the most common comparison factors between EdrawMax and Microsoft Visio are:
- MS Visio has limitations regarding providing the data flow diagram symbols and shapes. EdrawMax has vector-enabled symbols that let you create over 280 different types of diagrams, which is three times what Visio offers.
- Microsoft has stopped releasing Visio in its MS Suite bundle. In order to access the features of Visio, you will have to pay $5/user/month or $650 for a one-time purchase. EdrawMax comes with a $99/year plan and a lifetime plan that will cost you only $245, which comes with lifetime free upgrades, 10GB cloud storage, file backup & recovery, and more.
- Installing Visio can be a bit time-consuming as you are asked to fill out several questionnaires just to get you started. Downloading and installing EdrawMax is pretty straightforward. Head to the official website and download the data flow diagram software as per your operating system.
- Visio’s interface might be familiar to many because several companies used to use Visio for their diagramming purposes. However, most companies have now started opting for other tools that are more reliable. EdrawMax has the edge over MS Visio because of the thousands of templates accessible from the main window and the ability to provide data flow diagram symbols.
EdrawMax has a rich symbol library. From science diagrams to management diagrams, you will find over 50,000 vector-enabled symbols that are resizable, reshapable, and recolorable. Some of the most common data flow diagram symbols that are available at EdrawMax are:
- Process: In a data flow diagram, a process can be any function that changes the data and produces a different output. It is generally represented by a circle or a rectangle.
- Data Store: Data Store is commonly represented by two parallel lines.
- External Entity: In a data flow diagram, external entities are graphically illustrated by squares as the source or destination of data.
- Data Flow: Generally, the symbol for data flow is the arrow pointing towards the direction of the data flow.
EdrawMax is trusted by over 25 million users globally. With such a strong user base, we have hundreds and thousands of user-generated templates that are readily available for registered users to use and duplicate in the Templates Community. When working on data flow diagrams, head to the ‘Template’ section and search for data flow diagrams. The system will present some of the most common data flow diagram templates, like a data flow model diagram, data flow diagram template, Netflix data flow diagram, Salesforce Data Flow Diagram, Data Flow Diagram for Safehome, Azure Data Flow Diagram, and more.
Проектирование информационных систем (в MS Visio). Грибанов А.О.. Методические указания по выполнению практических работ для студентов специальности
DFD диаграмма для рассматриваемого в качестве примера магазина показана на рис.

Рисунок — Диаграмма потоков данных при обработке обращения аокупателя в магазин
Задание
Для предметной области Вашего варианта
1. Постройте 2-х уровневую функциональную модель в нотации IDEF 0
2. Заполните таблицы с описанием всех объектов построенной модели по форме таблицы 6.1.
3. Постройте диаграмму потоков данных ( DFD ) в исследуемом Вами бизнес-процессе.
4. Опишите все объекты, включенные в диаграмму DFD .
Диаграммы строятся либо в MS VISIO 2003, либо в MS WORD и представляются в виде соответствующих файлов.
Описания предоставляются в виде текстового документа MS WORD .
ПОСТРОЕНИЕ КОНТЕКСТНЫХ ДИАГРАММ
Контекстная диаграмма – это модель, которая представляет систему как набор действий, в которые каждое действие преобразует некоторый объект или набор объектов. Модель представляется как набор иерархических действий. Высшее действие иерархии называется действием контекста. Это самый высокий уровень, который непосредственно описывает систему. Уровни ниже называются порожденными декомпозициями и представляют подпроцессы родительского действия.
При создании модели сначала необходимо изобразить самый высокий уровень, действие контекста. Наименование действия описывает систему непосредственно и, как правило, состоит из одного активного глагола в сочетании с обобщающим существительным, которое разъясняет цель деятельности с точки зрения самого общего взгляда на систему.
Каждый блок может иметь различные типы связанных с ним стрелок. Стрелки обозначают людей, места, вещи, понятия или события. Стрелки связывают границы диаграммы с блоками, а также действия (блоки) на диаграмме между собой. В диаграммах IDEF имеется четыре основных типа стрелок.
Вход блока представляет материал или информацию, которая должна быть использована или преобразована блоком, чтобы выполнить действие. Стрелки входа всегда направляются в левую сторону блока.
Каждый блок должен иметь, по крайней мере, одну стрелку контроля (управления). Управление всегда входит в вершину блока. Управление представляется в виде правил, инструкций, политики, процедур и стандартов.
Стрелки выхода – это материал или информация, произведенная блоком. Каждый блок должен иметь, по крайней мере, одну стрелку выхода. Блоки, которые не производят информации лучше не моделировать вообще.
Механизмы исполнения – это те ресурсы, которые обеспечивают выполнение действия. В качестве механизма исполнения могут быть рассмотрены персонал компании, машины или оборудование, обеспечивающие выполнение действия.
УПРАЖНЕНИЕ 1. СОЗДАНИЕ КОНТЕКСТНОЙ ДИАГРАММЫ IDEF0
В качестве примера рассмотрим деятельность вымышленной компании «COMPUTER TRADE», которая существует 5 лет и занимается в основном сборкой и продажей компьютеров и ноутбуков. Годовой оборот компании составляет примерно 20 млн. дол.. Компания закупает компоненты для компьютеров от трех независимых поставщиков, а не производит их самостоятельно. Компания только собирает и тестирует компьютеры. Продукция реализуется через магазины и специализируется на покупателях, для которых главный критерий при покупке – стоимость компьютера.
- продавцы принимают заказы клиентов;
- операторы группируют заказы по типам компьютеров;
- операторы собирают и тестируют компьютеры;
- операторы упаковывают компьютеры согласно заказам;
- кладовщик отгружает заказы клиентам.
Улучшение деятельности компании должно касаться структуры управления компанией, эффективности производства и внутреннего контроля. В результате реорганизация может потребовать внедрения новой корпоративной информационной системы, состоящей не только из одного бухгалтерского модуля.
Однако перед тем как пытаться производить какие-то улучшения, необходимо разобраться в существующих бизнес-процессах.
Рис. 11. Контекстная диаграмма «Деятельность компании»
ДЕКОМПОЗИЦИЯ ДИАГРАММ
Декомпозиционное разложение модели используется в моделирование бизнес-процессов, чтобы дать более подробное описание блоков. Каждое из этих действий может в свою очередь быть декомпозировано. При каждой декомпозиции блока создается новая диаграмма. Число декомпозиций не ограничено и полностью зависит от уровня сложности, который необходимо показать в модели. Обратите внимание на рис. 14. Если действие не было декомпозировано, то в нижнем левом углу блока будет появляться символ «листа». После декомпозиции блока символ исчезнет.
Методика выполнения работы
1. Запустить редактор MS Visio 2010. Далее возможны два варианта создания DFD:
а) выбрать категорию шаблонов «Программы и базы данных», шаблон «Схема модели потоков данных», нажать на кнопку «Создать».
в) Выбрать категорию шаблонов «Бизнес» – «Бизнес-процесс» – Фигуры схемы потоков данных (нотация Йордана-Де Марко);
Предпочтительней использовать вариант «а)», объяснение этому будет дано ниже.
Странице нового документа дать название «DFD контекст».
2. Создать новую модель в стандарте DFD. В данной работе допускается рассмотрение DFD-модели не с самого верхнего уровня, а непосредственно с уровня той задачи, которая исследуется в лабораторных работах, например: «Учет материальных ценностей». Разместить на данной странице элементы DFD-диаграммы в соответствии с обозначениями в табл. Таблица 4.1.
Элементы диаграммы потоков данных
| № | Название элемента | Обозначение | ||
| В стандарте DFD | В редакторе Visio | В стандарте DFD | В редакторе Visio | |
| Нотация Гейна-Сарсона | Схема модели потоков данных | Нотация Гейна-Сарсона | Схема модели потоков данных | |
| 1. | Функция | Процесс | Процесс обработки данных | |
| 2. | Внешняя сущность | Интерфейс | Внешний элемент |  |
| 3. | Хранилище данных | Хранилище данных | Хранилище данных | |
| Стрелка | Поток данных | Динамический соединитель | → |
Студент на свое усмотрение может выбрать любую из представленных в MS Visio нотаций (Гейна-Сарсона или Йордана-Де Марко), так как ни одна из них полностью не соответствует стандарту DFD по внешнему виду элементов. Предпочтительней использовать нотацию Гейна–Сарсона, так как она больше подходит по внешнему виду. Основной недостаток реализации данной нотации в MS Visio в том, что ее основные фигуры («Функция», «Интерфейс» и «Хранилище данных») по умолчанию не имеют точек соединения, поэтому MS Visio при связывании этих фигур с помощью элементов «Поток данных» выстраивает линию соединения не всегда рационально. Но этот недостаток устраняется просто: достаточно добавить на соединяемые фигуры в нужном месте необходимые точки соединения (см. Лабораторная работа №3, п. 3.6.2). Тогда концы соединительных стрелок (потоков данных) будут четко «приклеены» к этим точкам, а отрезки ломанной соединительной линии можно подвинуть, так чтобы это выглядело красиво и аккуратно, потянув за зеленый курсор в середине отрезка.
На контекстной диаграмме («DFD контекст») разместить только один функциональный блок (Процесс), внешние сущности (Интерфейсы), и потоки данных, их соединяющие. Для элементов «Внешняя сущность» («Интерфейс») рекомендуется задать тень, так как это сильнее будет подчеркивать их визуальное отличие от функциональных блоков, и более будет приближено к стандарту DFD. Для задания тени нужно выделить элемент «Внешняя сущность», нажать клавишу F3 (или выбрать команду меню Формат – Заливка), в появившемся окне «Заливка» в категории «Тень» выбрать стиль «05: Смещение, вверх влево». Причем цвет тени не обязательно делать абсолютно черным, чтобы тень не сливалась со стрелкой. Напоминаю также, что для корректного отображения стрелок на DFD-диаграмме в нотации Гейна-Сарсона на соединяемые фигуры нужно добавить точки соединения, а для смещения подписей использовать изменение полей или элемент «Подписи» из шаблона «Фигуры схемы IDEF0». СССтрелки подписей в виде молний можно не отображать если задать им цвет белый или прозрачный. В результате проделанных действий контекстная диаграмма будет выглядеть примерно так, как показано на рис. Рис. 4.1.
Рис. 4.1. Контекстная диаграмма DFD AS-IS
3. Добавить новую страницу, переименовать ее в «DFD AS-IS». Разместить на ней все необходимые для построения DFD-диаграммы элементы. Задать для функционального блока на странице «DFD контекст» переход по двойному щелчку, как это было рассмотрено в п. 9 лабораторной работы №2.
Общие правила построения DFD-диаграмм:
· на DFD-диаграммах рассматривается движение (циркуляция) потоков данных при выполнении каких-либо процессов. Поэтому в отличие от IDEF0-диаграмм, на DFD-диаграммах нет явного начала и конца, и стрелки не должны приходить «из ниоткуда» и уходить «в никуда»;
· хотя на DFD-диаграммах в общем случае допускается отображать материальные потоки и процессы, при выполнении лабораторных работ по дисциплине «Проектирование информационных систем» этого делать не нужно. На DFD-диаграммах, создаваемых в рамках изучаемой дисциплины необходимо рассматривать только информационные потоки и функции их обрабатывающие;
· сначала должны быть рассмотрены функции (процессы), затем данные (хранилища), необходимые для выполнения этих функций. Подход «от данных к функциям» ведет к неправильному пониманию диаграммы;
· не должно быть связей между внешними сущностями. Во внешних сущностях не должно быть обработки информации;
· для хранилищ данных должен быть вход и выход. Должен соблюдаться закон сохранения информации: нельзя использовать того, чего нет в хранилище. Все что хранится, нужно использовать. Запросы к хранилищу данных на диаграммах не отображаются;
· нужно избегать пересечений стрелок, для этого можно создавать копии хранилищ данных. Множественные однородные потоки данных можно объединять в один;
· на диаграммах DFD не должно быть изолированных (несвязанных) объектов (внешних сущностей, подсистем, процессов, хранилищ данных).
К названиям элементов DFD-диаграмм предъявляются следующие требования:
Стрелки на DFD-диаграммах символизируют потоки данных, поэтому должны обозначать какой-то документ или информацию в именительном падеже, например: «Заказ от клиента», «Счет клиенту», «Запрос от поставщика» и др. Стрелки (то есть потоки данных) обязательно должны быть куда-то направлены (в функциональный блок, хранилище данных или внешнюю сущность) и откуда-то исходить.
Функциональные блоки символизируют функции по обработке потоков, направленных в них. Таким образом, в блок должен входить определенный документ или информация (например: «Заказ клиента»), а выходить другой документ, полученный в результате работы функционального блока (например: «Данные заказа»). Название блока должно отражать выполняемую им функцию, например: «Обработать заказы», «Проконтролировать оплату» и т.п. Или возможен иной вариант наименования функций: «Обработка заказов», «Контроль оплаты» и т.п.
Внешние сущности моделируют взаимодействие с теми частями системы (или другими системами), которые выходят за границы моделирования, они являются источниками или приемниками информации для работы моделируемой системы. Примерами названий внешних сущностей являются названия «Поставщики», «Клиенты» и др. В случае моделирования потоков данных в определенном подразделении предприятия в качестве названий внешних сущностей могут использоваться названия других (внешних по отношению к нему) подразделений, взаимодействующих с ним, например «Бухгалтерия», «Склад» и др. На одной DFD-диаграмме одна внешняя сущность может повторяться несколько раз, что позволяет сократить количество линий, соединяющих объекты на диаграмме.
Хранилища данных представляют собой объекты, собирающие и хранящие информацию. Роль хранилища данных на DFD-диаграмме следующая: в рамках движения информации потоки переходят от одной функции к другой, причем каждая из них совершает определенные преобразования над данной информацией. Часто бывает необходимо сохранить временно или постоянно какую-то информацию на пути ее движения от одной функции к другой (например, зафиксировать в базе данных поступивший заказ, или информацию об оплате счета). Для этого на DFD-диаграммах и используются хранилища данных. Они могут являться аналогами таблиц в схеме базы данных (на DFD-диаграммах AS-IS и TO-BE), а также бумажных хранителей информации (допускается только на DFD-диаграммах AS-IS). Названия хранилищ данных должны быть конкретными, и отражать суть хранимой в них информации. Например: «Клиенты», «Заказы» и др. Не допускаются «глобальные» и расплывчатые названия, такие как: «База данных», «Информационная система», «Архив» и т.п. Фрагмент DFD-диаграммы, иллюстрирующий название хранилищ данных показан на рис. Рис. 4.2. На одной DFD-диаграмме также допускается отображать одно и то же хранилище данных несколько раз.
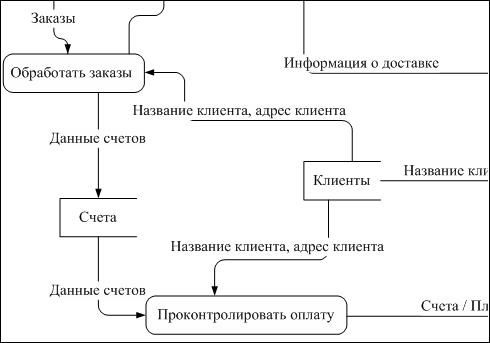
Рис. 4.2. Пример названия хранилищ данных. Фрагмент DFD-диаграммы
Названия внешних сущностей и хранилищ данных могут совпадать, например «Клиенты». В этом случае нужно понимать, что внешняя сущность «Клиенты» описывает конкретных клиентов, обращающихся к системе, а хранилище данных «Клиенты» представляет собой таблицу (т.е. информационную модель клиентов), в которой хранятся данные о клиентах.
Для соединения элементов посредством потоков данных нужно использовать элемент «Динамический соединитель» («Поток данных»). Подпись потока данных можно задать, щелкнув один или два раза по нему, и введя соответствующий текст. Смещать подписи к стрелкам можно за счет увеличения полей текстового блока (см. лабораторную работу №2, п. 5). Если подписи будут отображаться «не там, где нужно», или в случае большого количества фигур будут накладываться друг на друга, можно использовать элемент «Подпись» из набора элементов IDEF0. При этом, как говорилось ранее, лини можно сделать невидимыми.
4. Произвести анализ недостатков существующей модели AS-IS (наличие лишних функциональных блоков и отсутствие необходимых; наличие лишних потоков и отсутствие необходимых; дублирование функций, отсутствие необходимых хранилищ данных, не учтено поступление информации от внешних источников и т.п.).
5. Для каждого хранилища данных, представленного на DFD-диаграмме AS-IS привести описание с указанием его типа (бумажный носитель, таблица Excel, таблица базы данных, созданной в определенной СУБД и др.), и роли в перемещении и хранении потоков данных.
Вопросы для подготовки лабораторной работы
1. Каково назначение стандарта DFD?
2. В чем основные отличия стандартов IDEF0 и DFD?
3. Каким образом в MS Visio создается схема DFD? Какие для этого используются нотации?
4. Какова роль основных элементов в стандарте DFD?
5. Для чего строится DFD-модель AS-IS, что она показывает?
6. Какие элементы представляются на DFD-модели, каково их назначение?
7. Что является логическим развитием диаграммы потоков данных модели AS-IS?
Понравилась статья? Добавь ее в закладку (CTRL+D) и не забудь поделиться с друзьями:
How to Create a Data Flow Diagram in Visio?
A data flow diagram depicts the flow of information for any process or system. These diagrams range from basic level to multi-level depending upon the complexity of the process. Data flow diagrams are made up of rectangles, circles, arrows, text boxes to show data inputs, outputs, storage points, and the routes between each destination. Let’s look into its main components.
1.1 The Components of Data Flow Diagrams
- External Entity: The external entity is a system located outside the flow that sends and receives the data; thus, we call it the «Source» and «Destination.» The external entity could be a person, department, or an entire organization.
- Process: The process is any function that changes the raw data into finished output; labels are used to give the process its name. The process could be anything: a manufacturing process, service guide, computations, etc. depending on the nature of business.
- Data Stores: Datastores are places that hole the information, like files or documents. Datastores examples include the database table or membership form.
- Data Flow: Data flows are the routes that join the external entities, processes, and datastores. It illustrates the interface between the other components and is represented with arrows.
1.2 Data Flow Diagram Visio Tutorial
Now you are entirely educated with the main components of the data flow diagram from which the whole skeleton of the diagram is made, let’s learn how to create it using Microsoft Visio.
Step 1: Launch Visio
Launch the Microsoft Visio on your desktop to create a data flow diagram for a process. Then select File and click on New. From the categories, click on Software and Database. Click on Data Flow Diagram, and press «Create.»
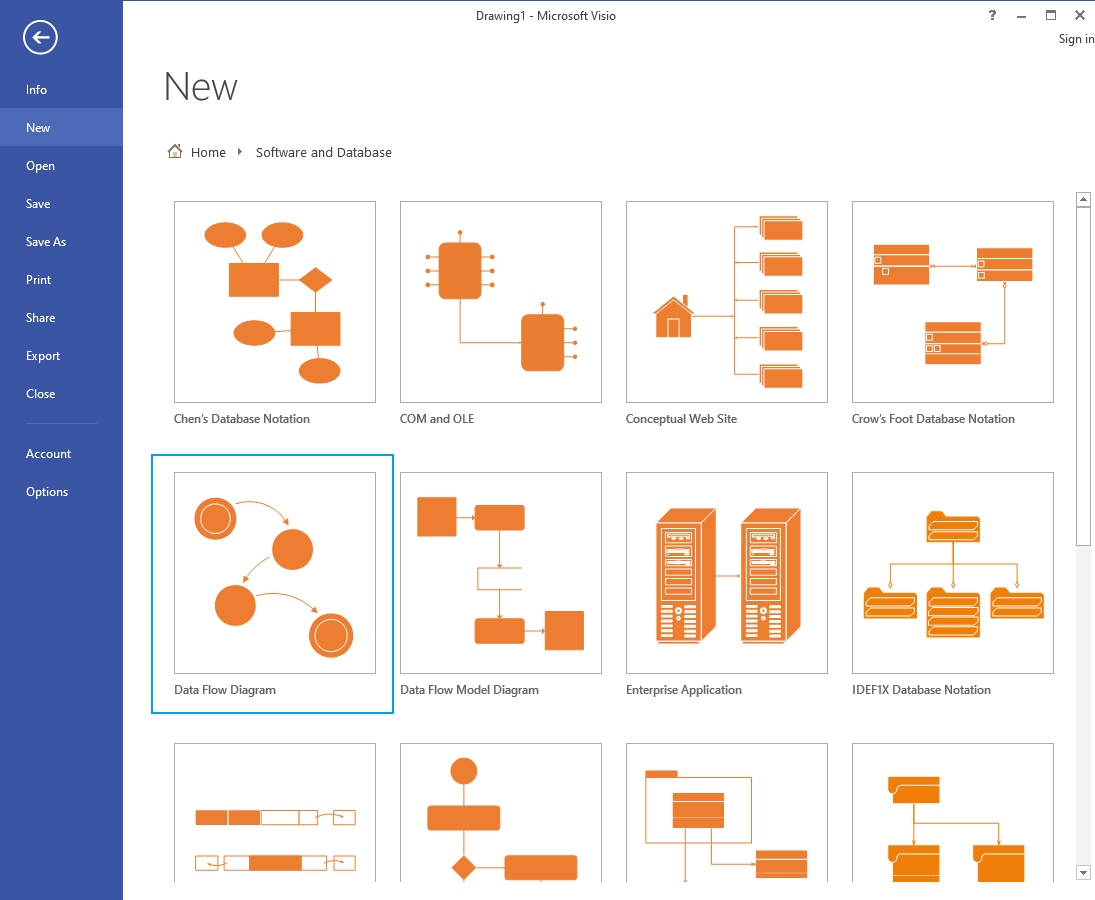
Step 2: Build with Shape Stencil
Drag the external interactor to the page of the diagram from the shape stencil. It will act as the source of information for the process. Drag some more shapes to represent the steps, stages, and entities involved in the process. Place an arrow into the drawing page using the connector tool. It should be close to the two shapes you wish to display data flow.
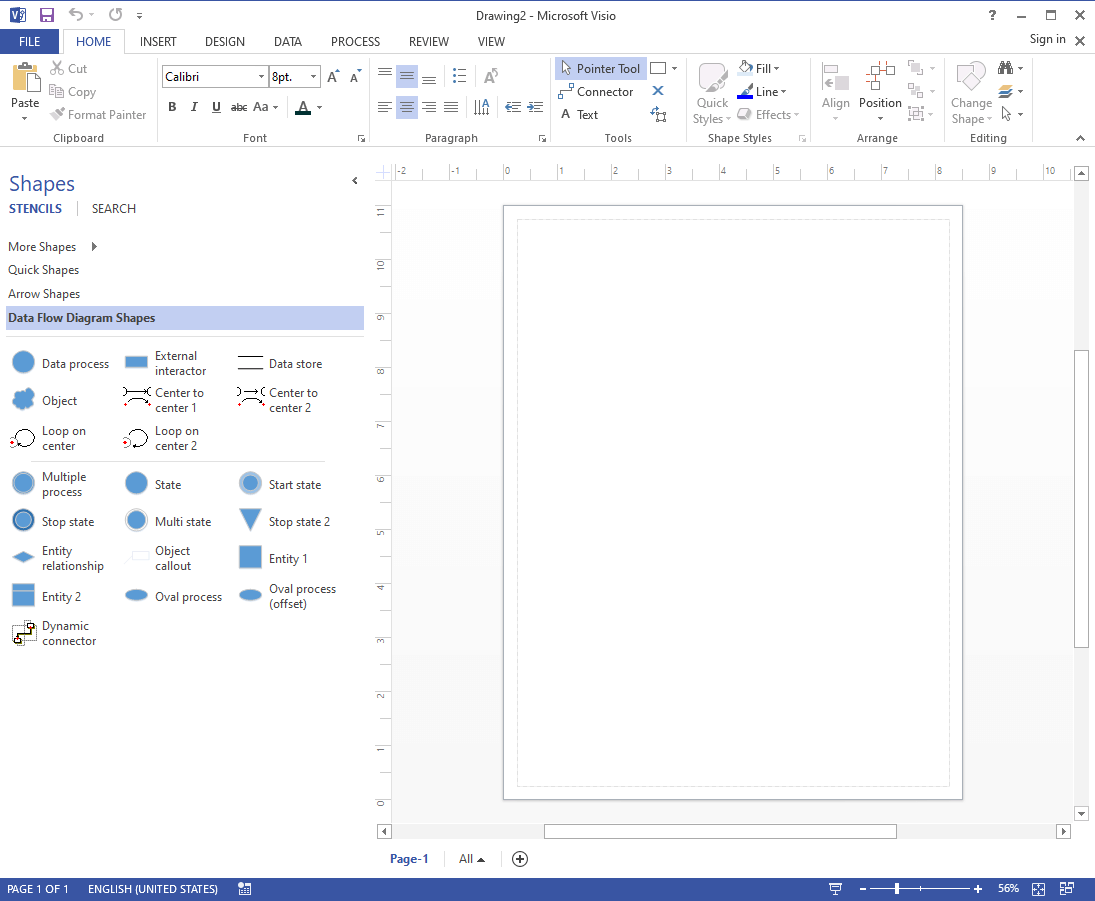
Step 3: Format the Diagram
To modify the direction of the arrow, pick it and then click Position on the Home tab in the Arrange group. Click Flip Horizontal or Flip Vertical after pointing to Rotate Shapes. Add more entities and connectors to illustrate the flow of the process entirely. There are more formatting tools available on the ribbon from which you can customize your diagram and give it an appealing look. Once your data flow diagram is completed, click on the File tab and then click on «save as» to store your data flow diagram.
2. How to Make a Data Flow Diagram Online Easier?
As you can see, creating a data flow diagram for a process in Microsoft Visio is so complicated and time-consuming; if you are a beginner, you must first learn the software and its tools, which can create a long hold up for your task. If you want to make an effective data flow diagram without any hurdles, then EdrawMax Online can resolve your problem. The application is a complete all-in-one diagramming tool.
Whether you need to create flowcharts, P&ID, UML diagrams, or design floor plans, office layouts, you can do all this in EdrawMax. EdrawMax provides solutions for more than 280 types of diagrams and charts. Let’s learn how to create a data flow diagram in EdrawMax.
Step 1: Choose Data Flow Diagram Template
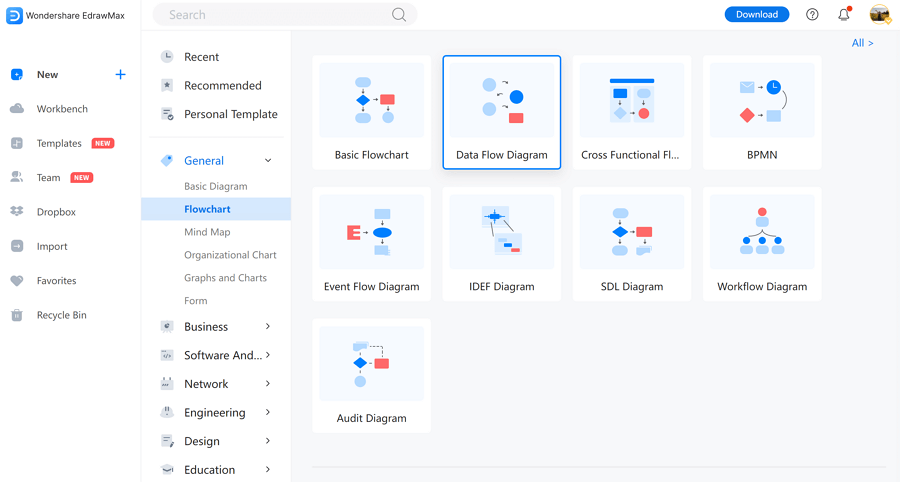
Browse the online application of EdrawMax and then log in to your registered email. Once the application is launched, Navigate to the «Flowchart» and then click on the Data Flow Diagram. From here, you can select to create a new data flow diagram or browse any template of your choice.
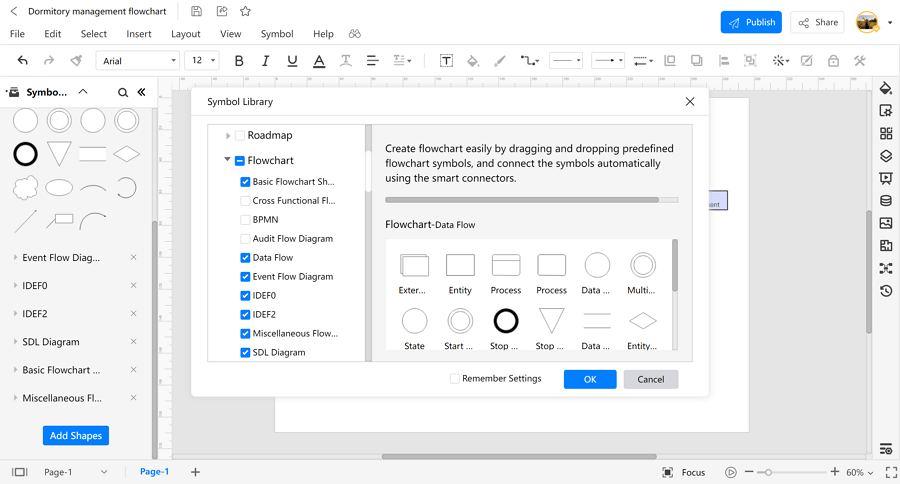
You can find and add the flowchart, data flow, and other symbols from the left libraries. All the pre-set symbols are free to use for Edraw users.
Step 2: Customize your Diagram
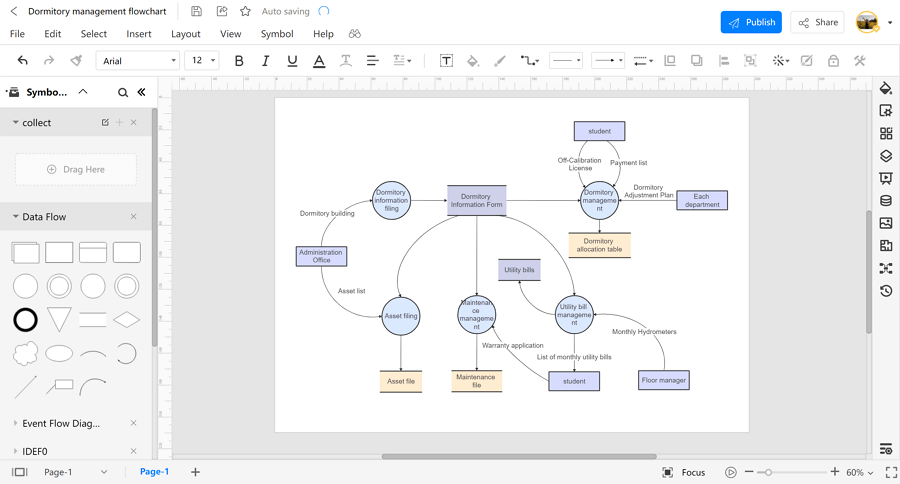
If you have chosen a pre-designed template, you can customize it as per the requirements of the process; alternatively, if you have started with a fresh template, draw, drag, and drop all kinds of entities and relationships from the sidebar. Add text to symbols that are significant to the process.
Step 3: Export a Document as a Visio File
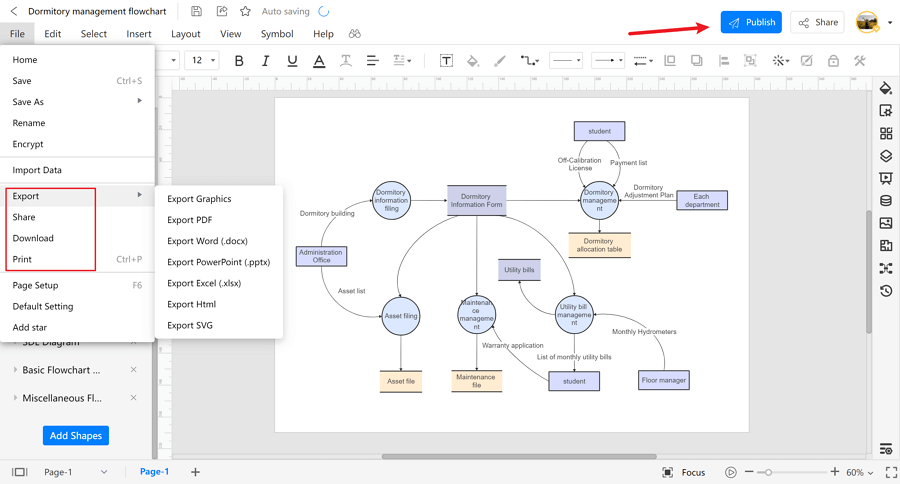
Once your data flow diagram is completed, it’s time to export it; you can export it to multiple formats, including PNG, PDF, VSDX, PPTX, and more. You can also export your data flow diagram to Visio files.
3. Data Flow Diagram Visio Examples
Some data flow diagram examples that you can edit or customize directly are below.
Example 1: Data Flow Diagram Level 0
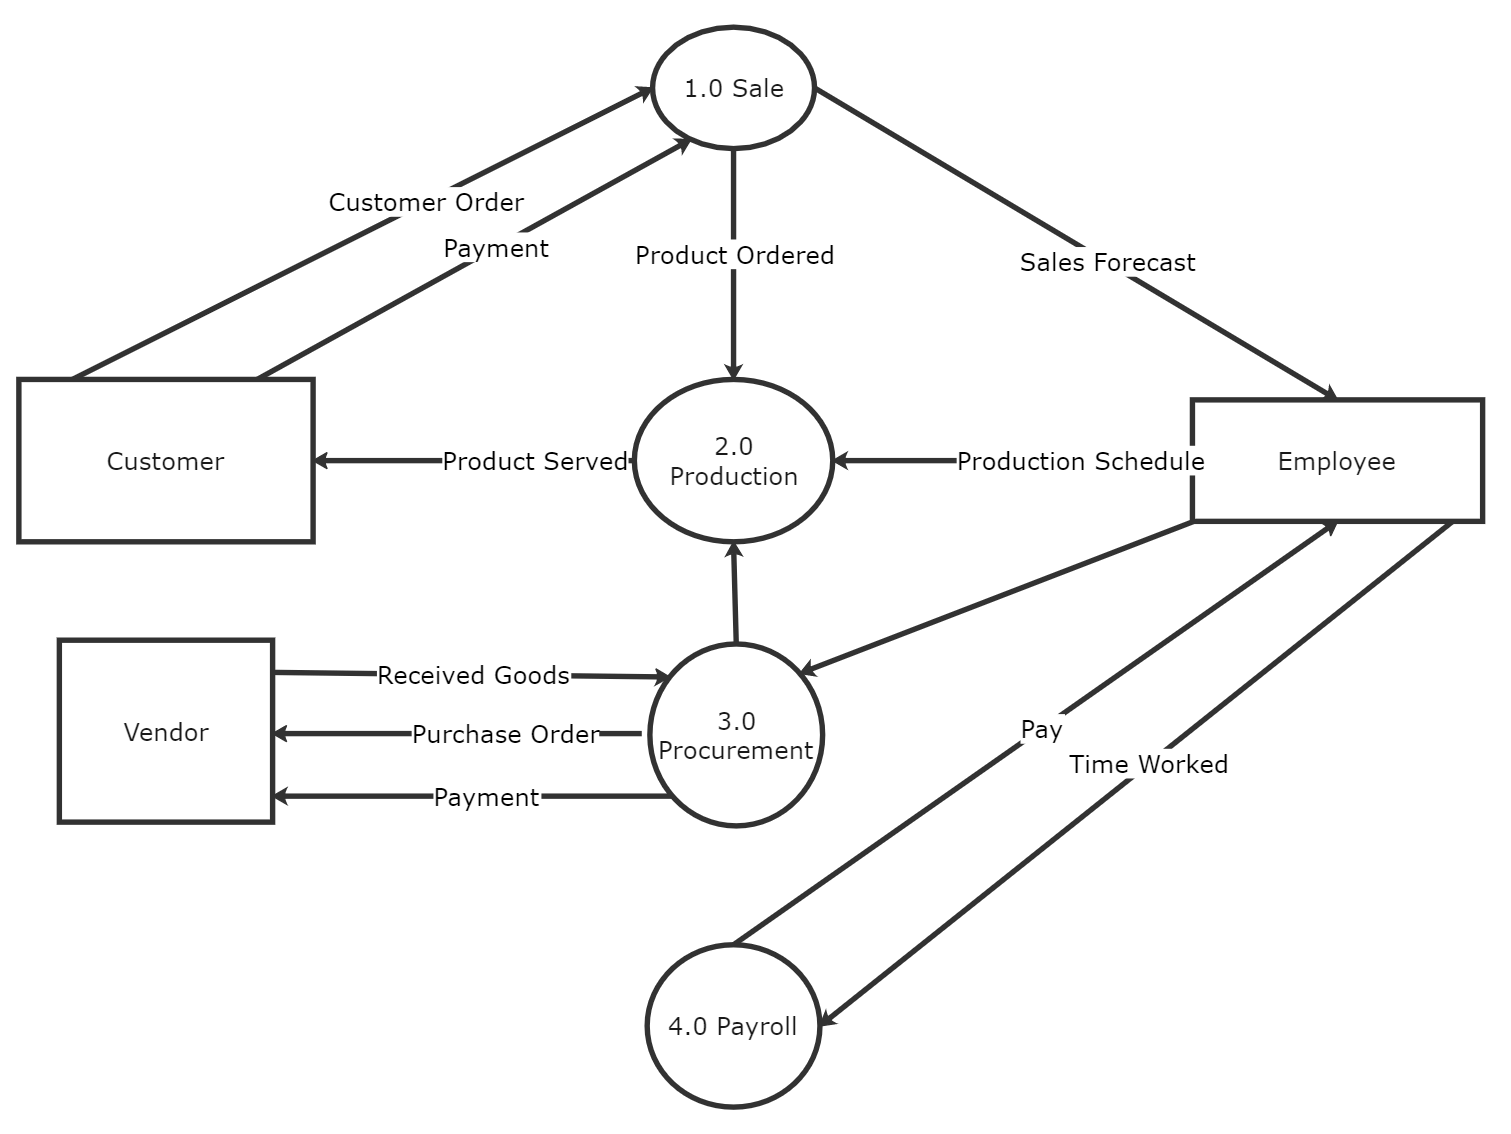
Here is an example of a Level 0 Data flow diagram, also known as «Context Diagram.» It’s a high-level overview of the entire system or process studied or modeled. It’s meant to be a quick peek into the system, displaying it as a single high-level process connecting to external entities. It emphasizes more on the external sources like here the procurement department is in connection with the Vendor, the production department is overseeing the customer for product services and with the employee regarding production schedule and lastly, the Sales department is in contact with its externalities; Customer regarding the order and payments and the employee regarding the sales forecast.
Example 2: Data Flow Diagram Level 1
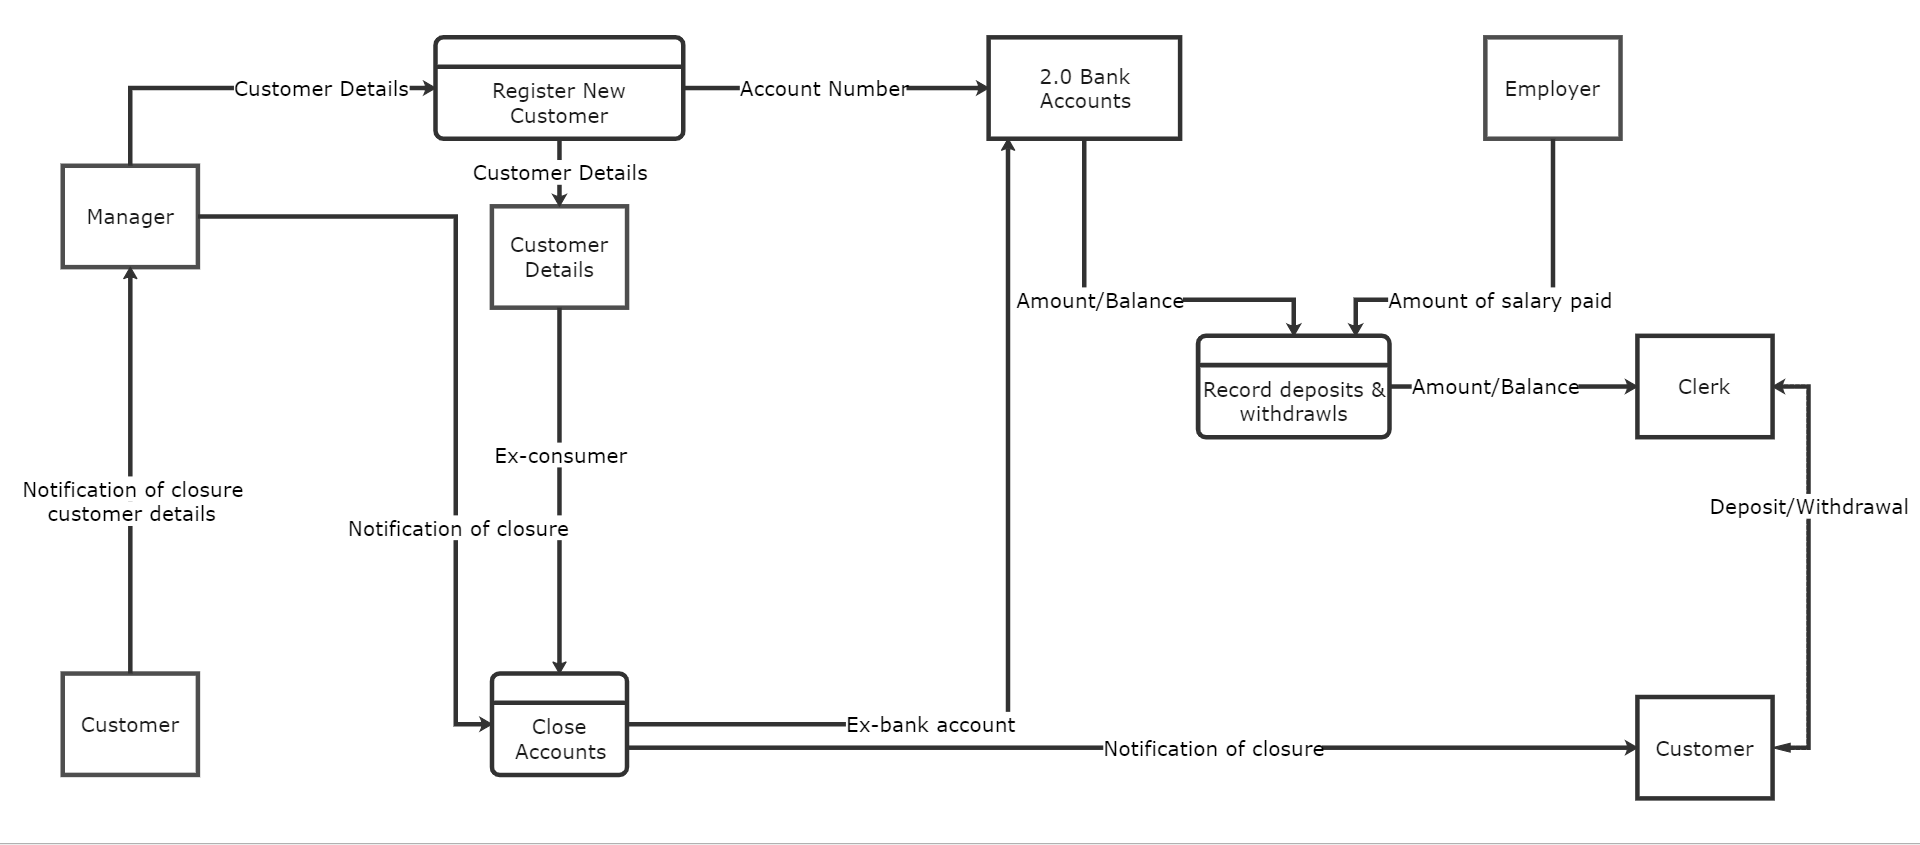
In this data flow diagram of a bank, multiple departments of the bank are shown and how they are interlinked with each other providing different services to its customers. In this example, the single process node from the context diagram is divided into subprocesses in the Level 1 data flow diagram. Additional data flows and data stores will be required to add these processes to the chart.
Example 3: Data Flow Diagram for Online Shopping
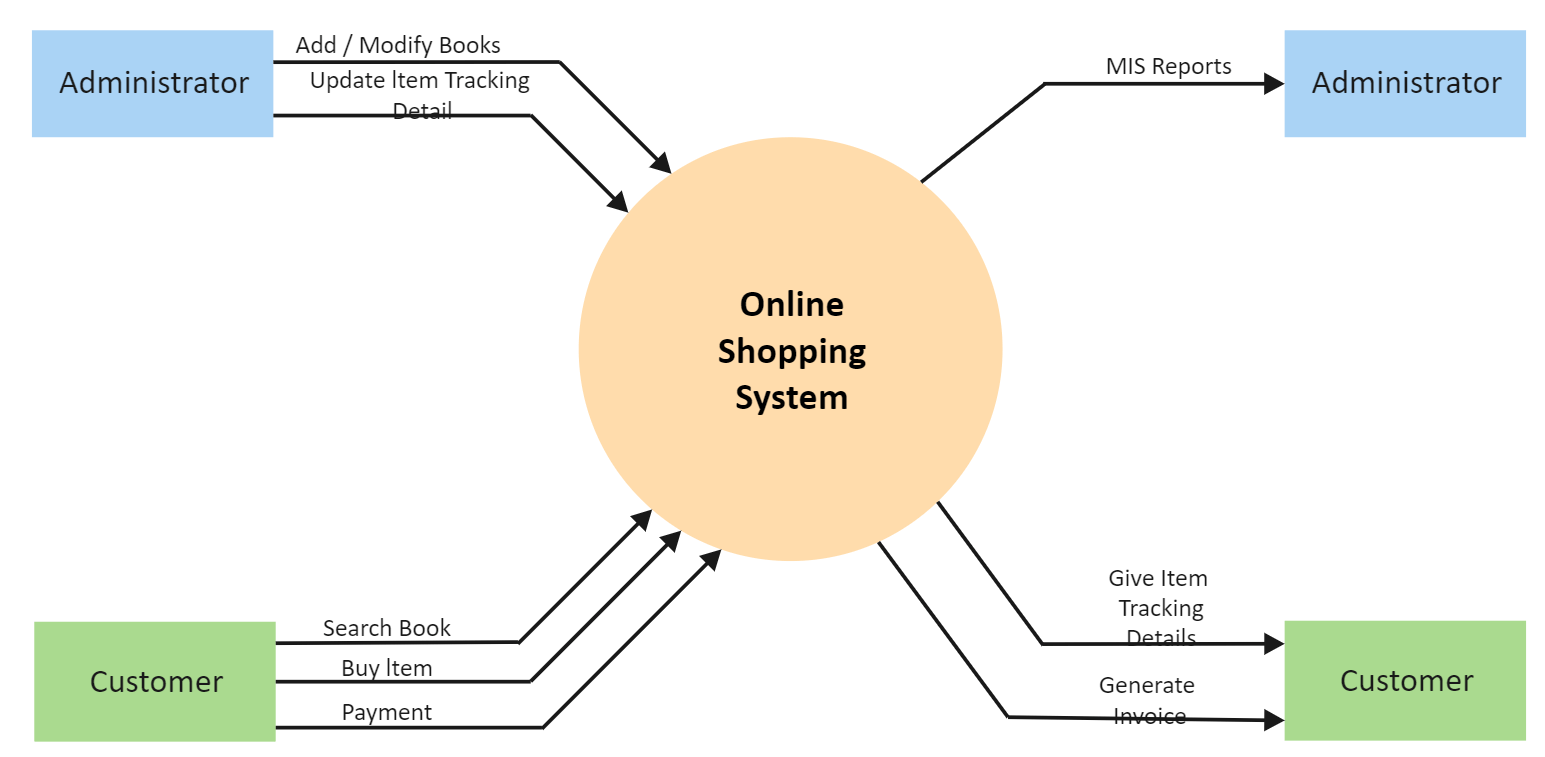
This example of an Online shopping system is also a Level 0 data flow diagram; the diagram depicts the flow of information between the system and its external entities or sources like here we have the Admin and the Customer. The admin updates the online shopping website, adds and modifies books, updates item tracking details, and communicates all the necessary information to the accounts team. The customer comes to the website to search for a book or to purchase any item, the system then gives item tracking detail to the customer, and after payment, it generates the invoice for the customer.
4. Online Data Flow Diagram Maker
EdrawMax Online is a user-friendly application that can meet your all diagramming needs; using EdrawMax, you can create more than 280 types of diagrams of different processes or systems. The software contains exciting and unique features and thousands of pre-designed templates to design a perfect data flow diagram for any process. The application is free, and users can access them on any browser, including Windows, Linux, or Mac.
The canvas in the online flowchart maker gives countless options of drawing lines, shapes, templates, and symbols for creating the essential decision points and other allied actions for converting the complicated process flow into an easily understandable and fascinating flowchart.