Как нормализовать данные в Excel
«Нормализация» набора значений данных означает масштабирование значений таким образом, чтобы среднее значение всех значений равнялось 0, а стандартное отклонение равнялось 1.
В этом руководстве объясняется, как нормализовать данные в Excel.
Пример: как нормализовать данные в Excel
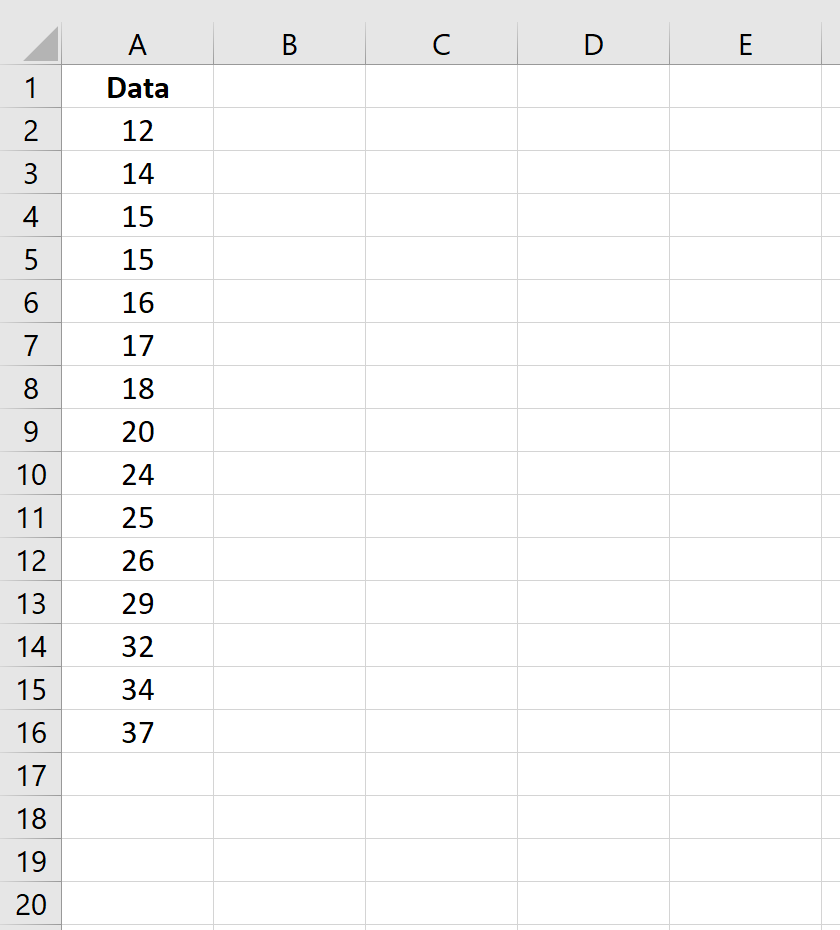
Предположим, у нас есть следующий набор данных в Excel:
Выполните следующие шаги, чтобы нормализовать этот набор значений данных.
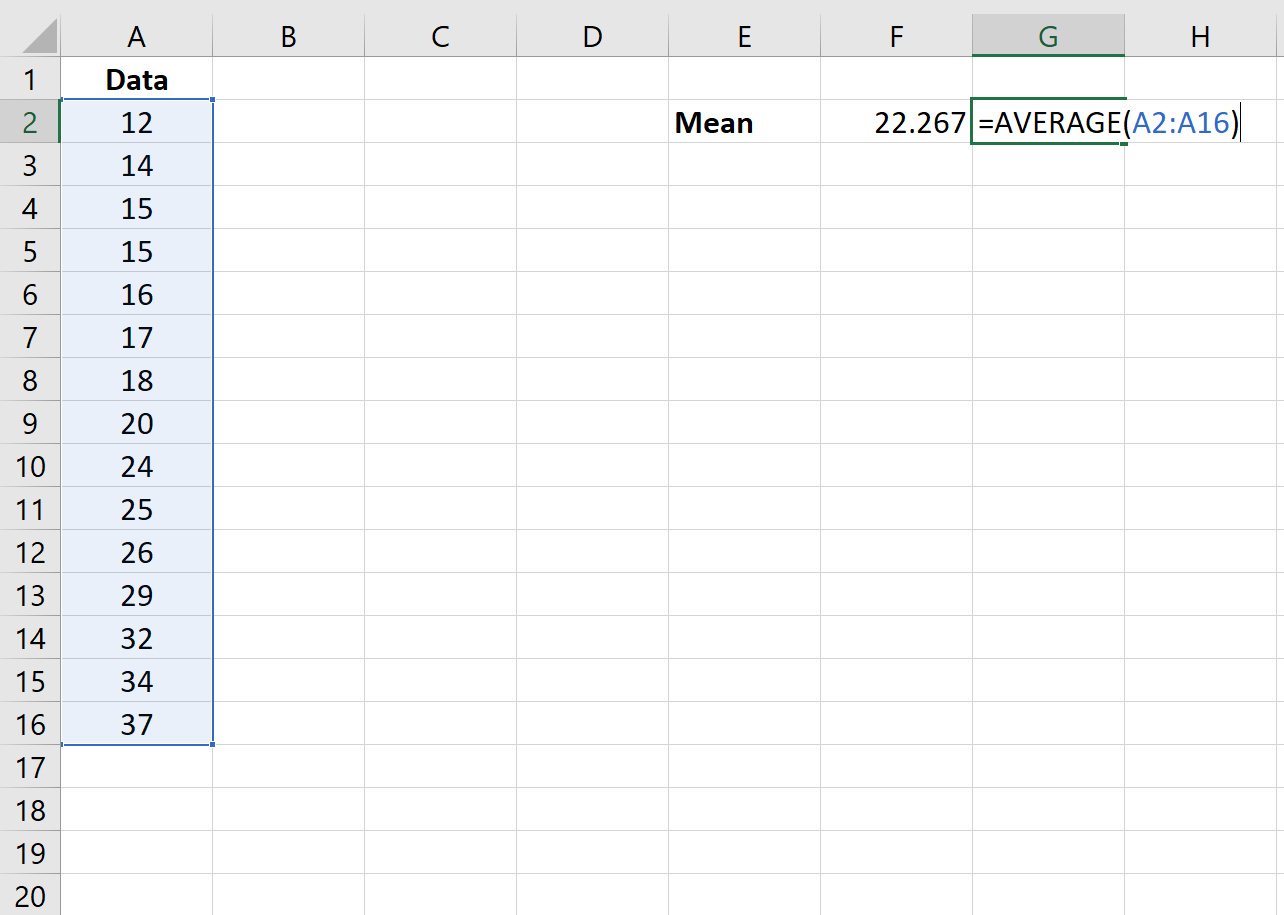
Шаг 1: Найдите среднее значение.
Во-первых, мы будем использовать функцию =AVERAGE(диапазон значений) , чтобы найти среднее значение набора данных.
Шаг 2: Найдите стандартное отклонение.
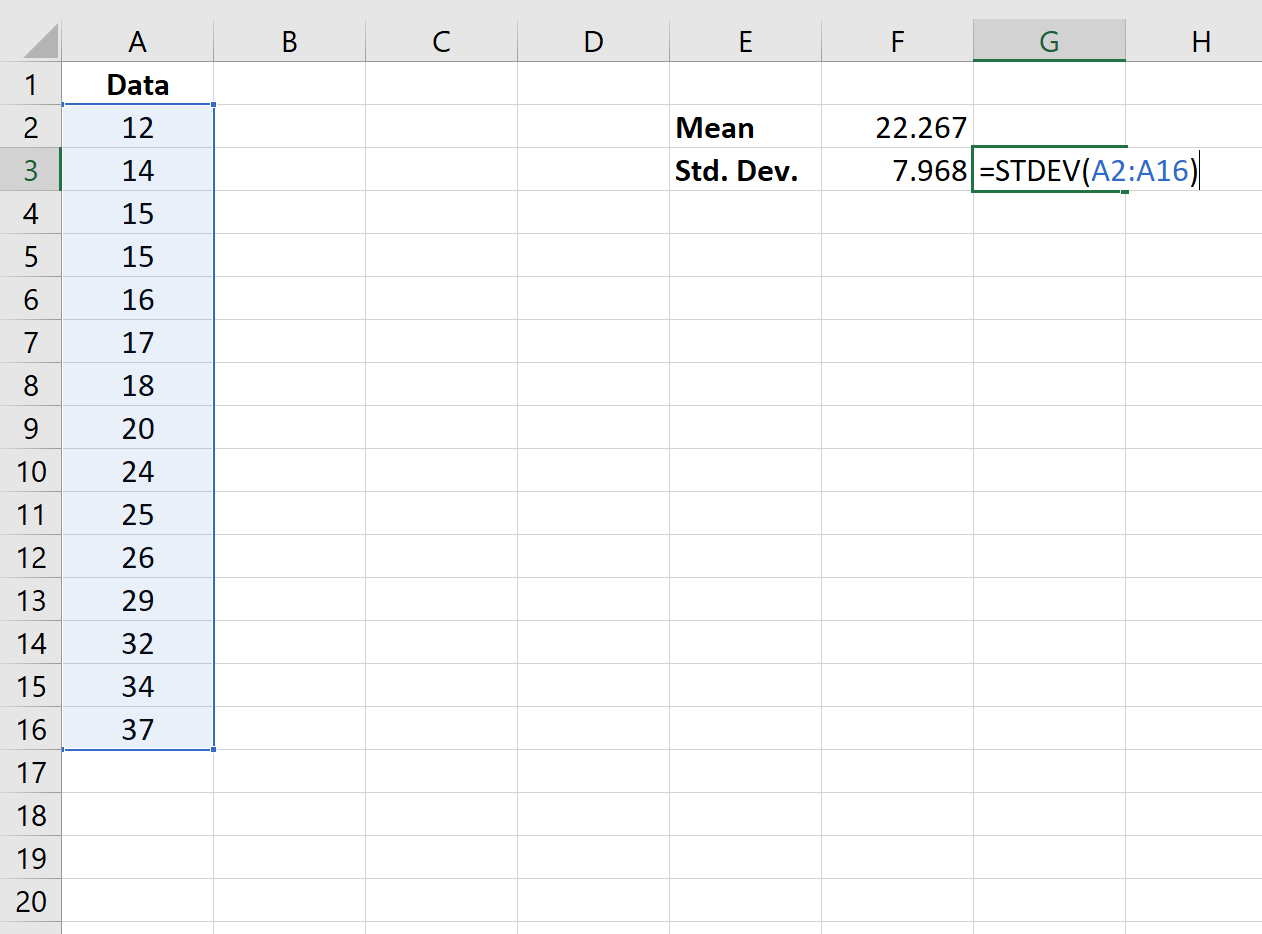
Далее мы будем использовать функцию = СТАНДОТКЛОН (диапазон значений) , чтобы найти стандартное отклонение набора данных.
Шаг 3: нормализуйте значения.
Наконец, мы будем использовать функцию STANDARDIZE(x, mean, standard_dev) для нормализации каждого из значений в наборе данных.
- х = значение данных
- x = среднее значение набора данных
- s = стандартное отклонение набора данных
На следующем изображении показана формула, используемая для нормализации первого значения в наборе данных:
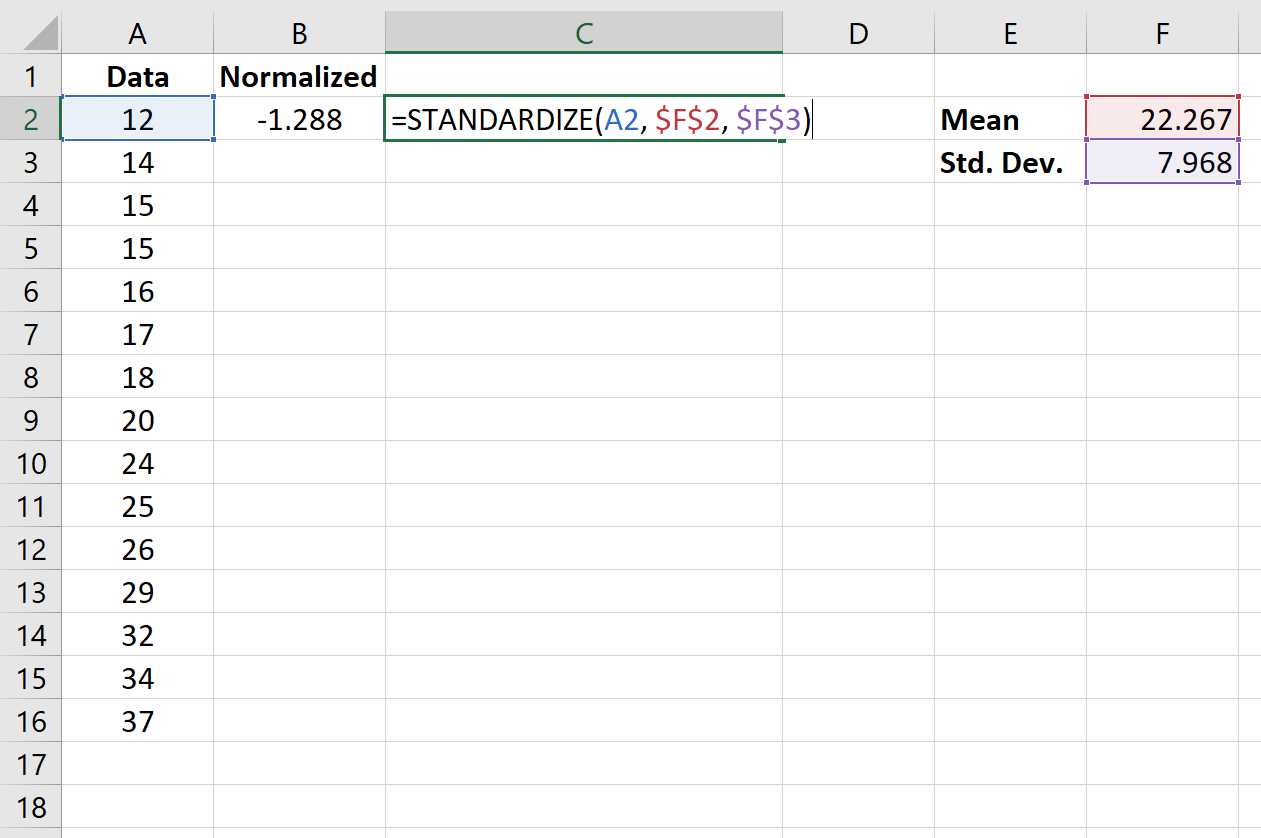
Как только мы нормализуем первое значение в ячейке B2, мы можем навести указатель мыши на правый нижний угол ячейки B2, пока не появится маленький +.Дважды щелкните + , чтобы скопировать формулу в оставшиеся ячейки:
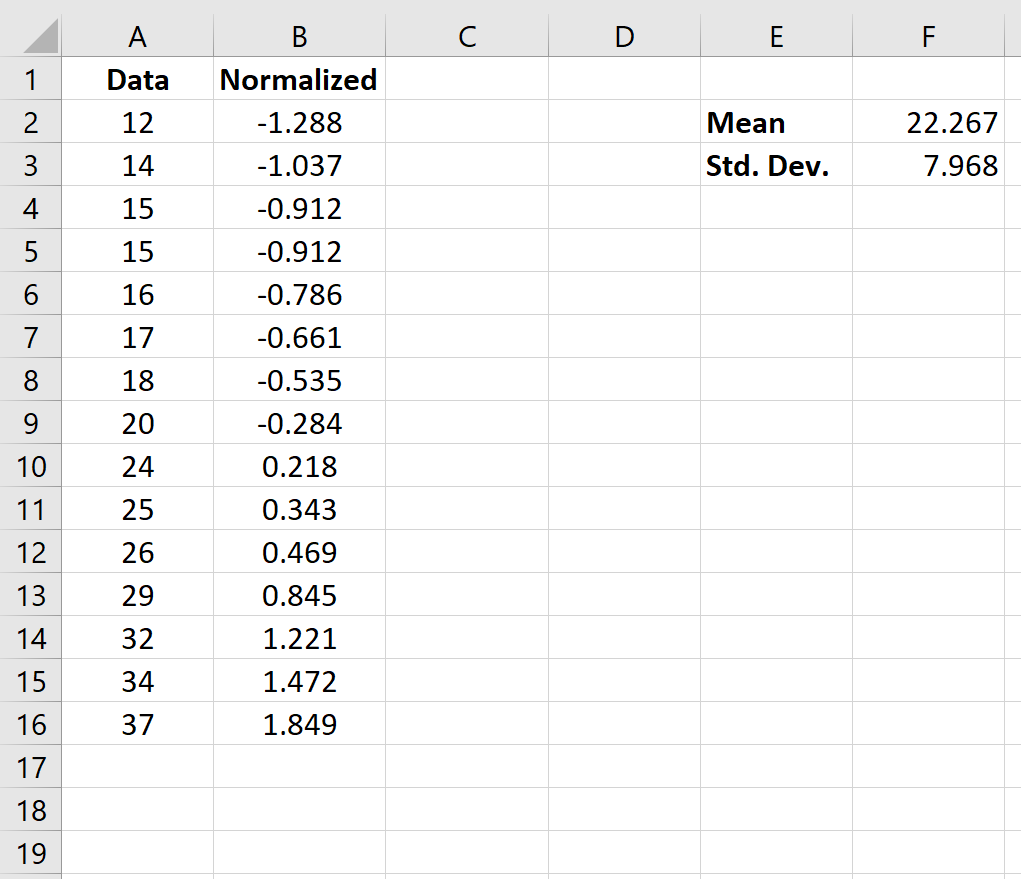
Теперь каждое значение в наборе данных нормализовано.
Как интерпретировать нормализованные данные
Формула, которую мы использовали для нормализации заданного значения данных x, была следующей:
Нормализованное значение = (x – x ) / с
- х = значение данных
- x = среднее значение набора данных
- s = стандартное отклонение набора данных
Если конкретная точка данных имеет нормализованное значение больше 0, это указывает на то, что точка данных больше среднего. И наоборот, нормализованное значение меньше 0 указывает на то, что точка данных меньше среднего значения.
В частности, нормализованное значение говорит нам, сколько стандартных отклонений исходной точки данных от среднего. Например, рассмотрим точку данных «12» в нашем исходном наборе данных:
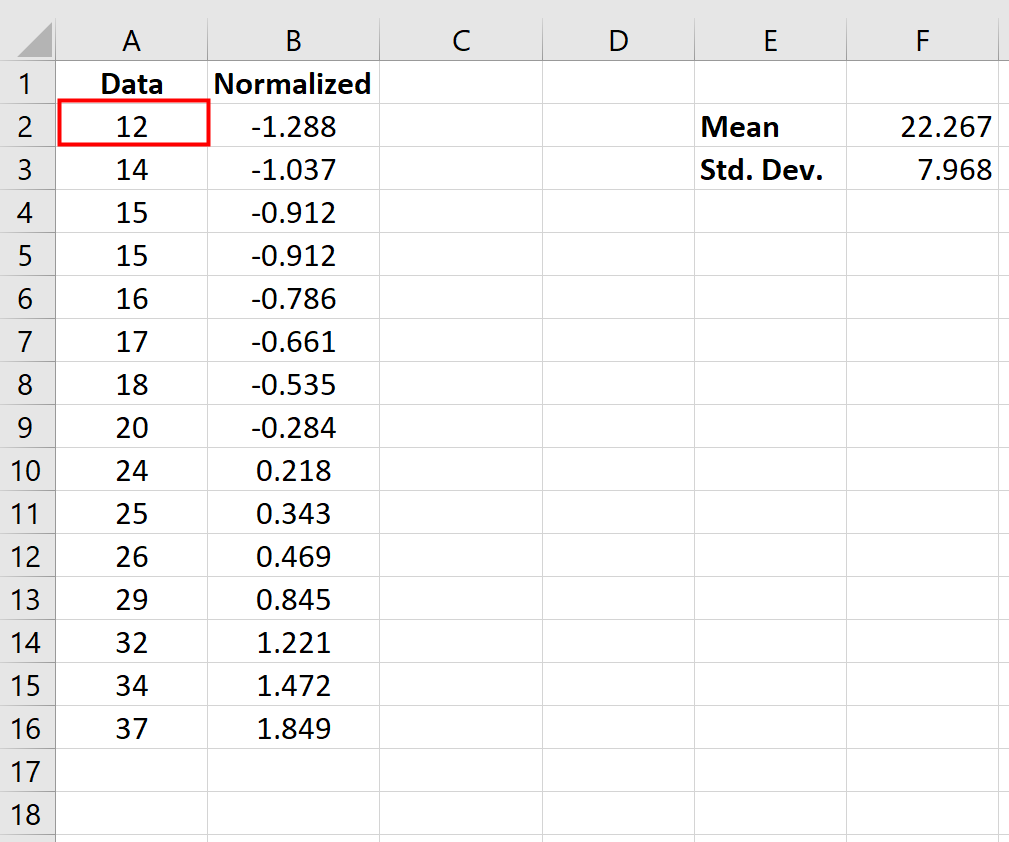
Нормализованное значение для «12» оказалось равным -1,288, которое было рассчитано как:
Нормализованное значение = (х – х ) / с = (12 – 22,267) / 7,968 = -1,288
Это говорит нам о том, что значение «12» на 1,288 стандартных отклонения ниже среднего значения в исходном наборе данных.
Каждое из нормализованных значений в наборе данных может помочь нам понять, насколько близко или далеко конкретное значение данных от среднего. Небольшое нормализованное значение указывает, что значение близко к среднему, в то время как большое нормализованное значение указывает, что значение далеко от среднего.
Как нормировать данные в excel
В этой статье описаны синтаксис формулы и использование функции НОРМАЛИЗАЦИЯ в Microsoft Excel.
Описание
Возвращает нормализованное значение для распределения, характеризуемого средним и стандартным отклонением.
Синтаксис
Аргументы функции НОРМАЛИЗАЦИЯ описаны ниже.
X Обязательный. Нормализуемое значение.
Среднее Обязательный. Среднее арифметическое распределения.
Стандартное_откл Обязательный. Стандартное отклонение распределения.
Замечания
Если standard_dev ≤ 0, возвращается стандартное #NUM! значение ошибки #ЗНАЧ!.
Уравнение для нормализованного значения имеет следующий вид:
Пример
Скопируйте образец данных из следующей таблицы и вставьте их в ячейку A1 нового листа Excel. Чтобы отобразить результаты формул, выделите их и нажмите клавишу F2, а затем — клавишу ВВОД. При необходимости измените ширину столбцов, чтобы видеть все данные.
Значение, которое нужно нормализовать.
Среднее арифметическое распределения.
Стандартное отклонение распределения.
Нормализованное значение числа 42, полученное с использованием числа 40 в качестве среднего арифметического и числа 1,5 в качестве стандартного отклонения.


Нужна дополнительная помощь?
Нужны дополнительные параметры?
Изучите преимущества подписки, просмотрите учебные курсы, узнайте, как защитить свое устройство и т. д.




В сообществах можно задавать вопросы и отвечать на них, отправлять отзывы и консультироваться с экспертами разных профилей.
Normalizing Numerical Values in Excel

Before running any sort of analysis, a lot of the times we need to normalize numerical values to fit a certain range or distribution.
This process is generally known as normalization. However, it can also be called standardization or transformation. The three terms are actually different:
Normalization — Changing the original numerical values to fit within a certain range.
- For e.g., you want to modify test scores that could be between 0–100 to be within the range 0–1.
- You might want to normalize when you have multiple variables with differing ranges. For e.g., if you have variables Test Score 1 and Test Score 2 where Test Score 1 was out of 100 while Test Score 2 was out of 40.
The formula for normalizing a value x that comes from a range (y, z) between a range (a, b):
Standardization — Changing the original numerical values to fit within a distribution that has a mean of 0 and standard deviation of 1. The standardize values are also called z-scores, which you can then use to see how far a given value is from a certain mean.
- For e.g., you have stock market data for 30 days that has a mean of 550 and standard deviation of 3 but you want to standardize the data so the mean is 0 and standard deviation is 1.
- You might want to standardize to detect outliers in a given range or to compare two disparate sets of data. For ex: if you have stock market data for Company A with the above mean and standard deviation and then you have stock market data for Company B that has mean of 750 and standard deviation of 5.
The formula for standardizing a value x from range (y, z):
Transformation — Changing the original numerical values to fit a specific distribution that your data analysis needs.
- This is a more complex topic that we will cover in a separate blog post.
- Meanwhile, if you are interested you can read more about transforming data to a normal (gaussian) distribution, also known as a bell curve, by using the Box Cox transform. This is just one of many other transforms available
How To Normalize Values in Excel
First, let’s see what kind of values we will be normalizing. These are test scores for 39 students in an Intro to Computer Science class on Test 1 and Test 2. Test 1 was scored out of 50 while Test 2 was scored out of 40.
Our dataset originally had two columns Test 1 and Test 2. I have also added Test 1 Norm and Test 2 Norm. You can download the full file with the normalized scores and formulas here.
The reason we are normalizing is we want to create a predictive model that can take some variables such as student household income, residential area etc. and accurately predict the students test scores on future tests.
We will be normalizing both scores between 1–5 simply because we will have some integer values and it will be easier for people to share their scores. You can substitute the min and max of your range in the formula below.
Once again the formula for normalizing is:
First we are going to normalize Test 1 scores. So in cell C2, we will enter the following Excel formula
Let’s walk through the formula real quick:
- b is the max value of the range we want to normalize to, which in this case is 5
- a is the min value of the range we want to normalize to, which in this case is 1
- Since we are starting from A2, we put that as the first x value. When we drag down the formula the A2 will get replaced with the corresponding input x value
- y is the minimum of our input range. We determine the minimum of the range by the MIN formula in Excel. We give the range with the dollar signs because we don’t want those variables to be changed as we drag the formula down. So our range is given $A$2:$A$40. The 40 is because we have 39 students, we would change this to our max row whatever that might be.
- z is the maximum of our input range. We determine the maximum of the range by the MAX formula in Excel. We give the same range as above.
- Finally, we add 1 to everything as that is the minimum of our normalized range
Entering and dragging this down in the Test 1 Norm column gives us the following normalized scores for the first 10 students for Test 1
We will do the same for Test 2 except the x value in the Excel formula will change to B2 to correspond to the Test 2 score and the range will change to $B$2:$B$40
Entering and dragging this formula down in the Test 2 Norm column gives us the following normalized scores for the first 10 students for Test 2
As you can see it is now waayyyy easier to compare scores. Nothing is too dramatic in these 10 scores but you can judge how much better someone did way easier.
How to Normalize Data Excel – Normalization in Excel
How to Normalize Data Excel – Normalization in Excel

How to Normalize Data Excel – Normalization in Excel
As an analyst, you must have encountered the concept of data normalization many times while working. This grave concept demands recognizing its importance for the success of an analyst. Therefore, you need to learn how to normalize data Excel for successful project completion.
What is Normalization?
Normalization is often considered as standardization, in which you can transform data based on the mean and standard deviation for the complete dataset. This transformed data simply refers to a standard distribution with a mean of 0 and variance of 1.

The values you see above the mean are positive values, whereas the values that appear below the mean are negative values.
Normalizing Data in Excel:
Standardized is a function that lets you calculate and shows the normalized value from a distribution that arithmetic mean and standard deviation describes. For this function, you need to have the arithmetic mean and standard deviation values from the user.
STANDARDIZE(x, mean, standard_dev)
When you need to find the arithmetic mean of a dataset, you can simply use the AVERAGE function.
AVERAGE(number1,[number2],…)
To find the standard deviation of a dataset, you can avail of two options based on the size of your data:
STDEV.P: STDEV.P(number1,[number2],…)//It is used for whole population
STDEV.S: STDEV.S(number1,[number2],…)// It is used for a sample of data
How to Normalize Data Excel:
The process of finding standardization is not much tricky. Suppose that you need to find a list of values from y to z that starts with the number X.
X: It is the first value that appears in the list
The formula that lets you find the standardized value X is:
X_standardized = (X – mean of range)/ standard deviation of the range
Below is the Excel formula you can use for this calculation is:
=STANDARDIZE (X; mean of range; standard deviation of the range)
For this formula, you would have to find the mean and standard deviation formulas.
The formula for Mean calculating is = AVERAGE(range of values)
The formula for Standard Deviation is =STDEV(range of values)
Now, let’s understand these formulas with an example:
First, you need to find the mean value. For this, you can use the following formula:
=AVERAGE(range of the values)

Next, you need to find the standard deviation. For this, you can use the following formula:
=STDEV(range of value)
Since we have everything we need to find the normalized data, let’s find it out by following the below-given formula:
=STANDARDIZE(X, mean of range, standard deviation of the range)
Final Words:
Normalization or standardization functions are equally important when you are assigned to make a presentation on a specific subject or else when you need to minimize the data size to make deductions. Both functions are used for calculating the mean and standard deviation and each function has its formula that you can use.
Excel as you know is an extensive tool for analyzing datasets of multiple kinds that’s why advancement has been made in this software to perform functions of any kind.